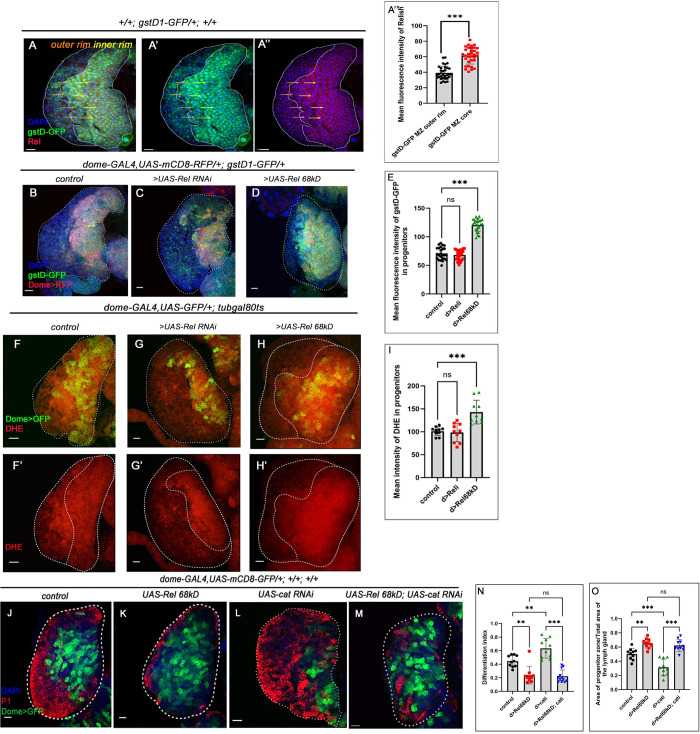
Fig 2. Progenitor-specific Rel loss leads to ectopic differentiation, which is ROS-independent.
(A-A”) Rel expression is enriched in the bulk of the gstD1-GFP expressing progenitors (yellow arrows), while downregulated in the ones present in the peripheral region of the MZ (orange arrows). (A”’) Mean fluorescence intensity of Relish expression in the progenitors A-A” (lymph glands n = 33 for mentioned genotype, P-value < .001). (B-D) ROS level in the progenitor visualized by gstD-GFP in control (B) is comparable to Rel loss (C), while significantly high GFP expression can be seen upon progenitor-specific Rel overexpression (D). (E) Mean fluorescence intensity of gstD-GFP expression in the progenitors B-D (lymph glands n≥24 for each genotype, P-values from left to right = 0.615, and <0.001, respectively). (F-H’) ROS level (DHE) is high in the progenitors upon sustained Rel expression (H, H’), whereas the levels upon Rel loss from progenitors (G, G’) is comparable to control (F, F’). (I) The mean intensity of DHE in the progenitors F-H’ (lymph glands n = 10 for each genotype, P-values from left to right = 0.941 and <0.001, respectively). (J-M) UAS-cat RNAi leads to ectopic differentiation (L) while sustained expression of Rel causes halt in differentiation (K) compared to control (J). The co-expression of UAS-cat RNAi and UAS-Rel 68kD (M) is unable to rescue the differentiation defect that is otherwise observed in Rel overexpression (K). (N) Differentiation index for genotype J-M (lymph glands n ≥ 10 for each genotype, P-values from left to right = 0.001, = 0.004, = 0.988, and <0.001 respectively). (O) The ratio of the area of progenitors to that of the total area of the primary lobe for the genotypes J-M (lymph glands n = 10 for each genotype, P-values from left to right = 0.003, <0.001, = 0.871, and <0.001 respectively). Genotypes are as mentioned. Each dot in the graph represents individual values, Data is expressed as mean ± SD. Statistical analysis: Tukey’s multiple comparisons tests. Unpaired t-test with Welch’s correction for A”’. P-Value of <0.05, <0.01 and<0.001, mentioned as *, **, *** respectively. Scale bar: 20μ, DAPI: nucleus.

