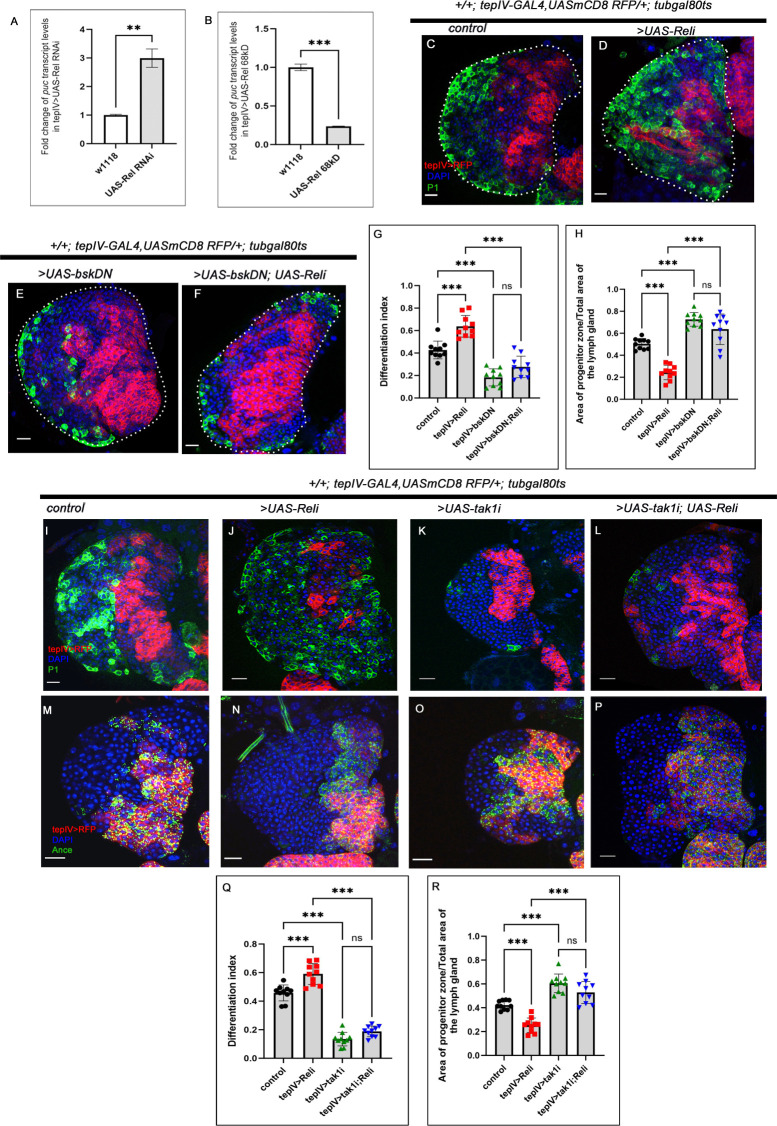
Fig 3. Relish checks JNK activation in the progenitors via tak1 function to prevent precocious differentiation.
(A-B) Levels of puc transcripts upon progenitor-specific Rel downregulation (A) (N = 3, P-value <0.0083), (B) Rel overexpression causes a decrease in puc transcripts (N = 3, P-value: 0.001). The RNA was obtained from FACS-sorted progenitors via GFP expression using tepIV-GAL4>UAS-2XEGF. (C-F) Compared to control (C), the loss of JNK activity alone halts the differentiation program (E). Downregulating JNK (by UAS-bskDN) in Rel loss genetic background rescues the ectopic differentiation (F), which was otherwise observed upon Rel loss (D). (G) Differentiation index for genotypes C-F (lymph glands n = 10 for each genotype, P-values from left to right <0.001, <0.001, <0.001, and, = 0.096 respectively). (H) The ratio of the area of progenitors to that of the total area of the primary lobe for the genotypes mentioned in C-F (lymph glands n = 10 for each genotype, P-values from left to right <0.001, <0.001, <0.001 and = 0.114 respectively). (I-L) Compared to control (I), downregulating TAK1 in Rel loss genetic background rescues the differentiation defects (L), which were otherwise observed upon progenitor-specific Rel loss (J). Loss of tak1 activity alone halts the differentiation program (K). (M-P) Compared to control (M), a significant increment in progenitor number is evidenced upon loss of tak1 (O). Downregulating TAK1 in Rel loss genetic background restores the progenitor number (P), which is otherwise declines upon Rel loss (N). (Q) Differentiation index for genotypes I-L (lymph glands n = 10 for each genotype, P-values from left to right <0.001, <0.001, <0.001 and = 0.147 respectively). (R) The ratio of the area of progenitors to that of the total area of the primary lobe for the genotypes mentioned in M-P (lymph glands n = 10 for each genotype, P-values from left to right <0.001, <0.001, <0.001 and = 0.088 respectively). Genotypes are as mentioned. Each dot in the graph represents individual values, Data is expresses as mean±SD. Statistical analysis: Unpaired t-test with Welch’s correction for qPCR and rest Tukey’s multiple comparisons tests. P-Value of <0.05, <0.01 and<0.001, mentioned as *, **, *** respectively. Scale bar: 20μ, DAPI: nucleus.

