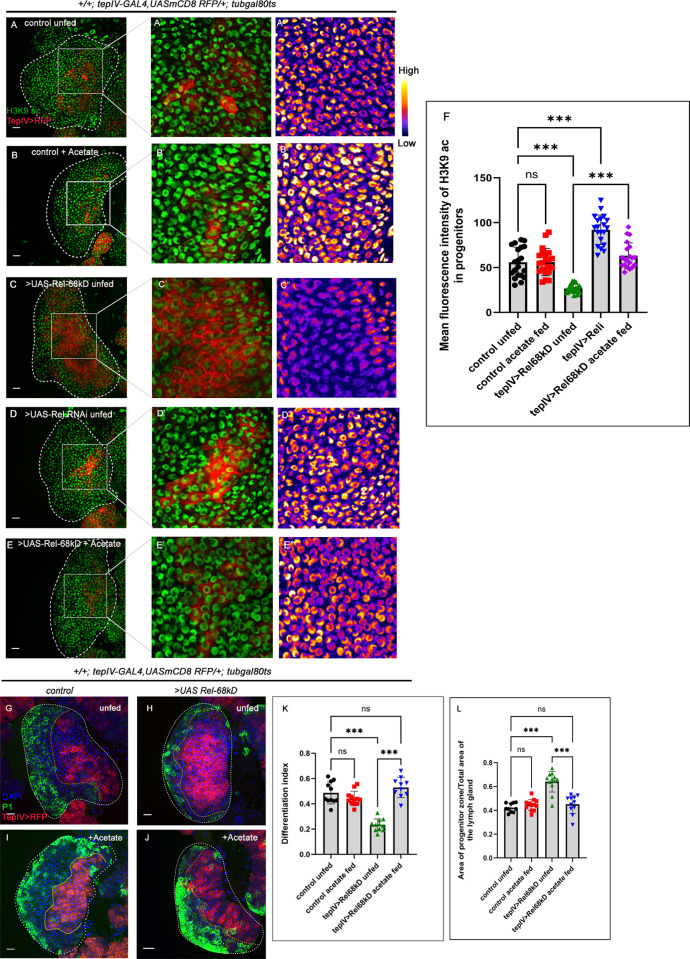
Fig 5. Upregulated JNK-FAO axis modulates histone acetylation pattern in the progenitors upon Rel loss.
(A-E") Compared to control (A-A"), a drastic reduction in H3K9 acetylation (green) in tep-IV positive progenitors was observed in Rel overexpression (C-C"). In contrast, Rel loss resulted in a slight increase in H3K9 acetylation (D-D"). Acetate-supplementation rescued the acetylation defects seen in the progenitors upon Rel overexpression (E-E") but remained unaltered in control acetate fed (B-B"). (F) The mean fluorescence intensity of H3K9 acetylation in progenitors (A-E") (lymph glands n = 20 for each genotype, P-values from left to right = 0.999, <0.001, <0.001, and <0.001, respectively). (G-J) Rearing the larvae in acetate-supplemented food rescued the halt in differentiation (J) in the Rel overexpression background, which was otherwise observed in progenitor-specific Rel overexpression (H) and is now comparable to that of control (G). Acetate supplementation in control larvae does not affect differentiation level (I). (K) Differentiation index for genotype in (G-J) (lymph glands n≥10 for each genotype, P-values from left to right = 0.436, <0.001, = 0.489 and <0.001 respectively). (L) The ratio of the area of progenitors to that of the total area of the primary lobe for the genotypes mentioned in G-J (lymph gland n≥10 for each genotype, P-values from left to right = 0.847, <0.001, = 0.766 and <0.001 respectively). Genotypes are as mentioned. Each dot in the graph represents individual values, Data is represented as mean ± SD. Statistical analysis: Tukey’s multiple comparisons tests. P-Value of <0.05, <0.01 and<0.001, mentioned as *, **, *** respectively. Scale bar: 20μ, DAPI: nucleus.

