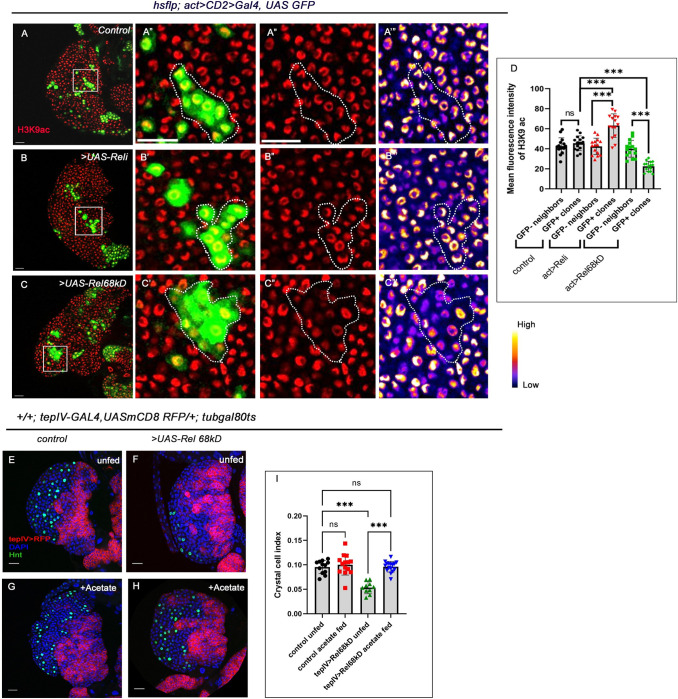
Fig 6. Clonal analysis reveals that H3K9 acetylation is altered upon perturbation of Rel expression in the progenitor-pool.
(A-C”’) Clonal analysis of histone acetylation (H3K9 acetylation) in the GFP-positive hs-flp; act>CD2>Gal4, UASGFP-based clonal patches [GFP indicates cells wherein Rel function is downregulated (B-B”’) or cells with sustained Rel expression (C-C”’) compared to GFP patches of mock clones (A-A”’)]. (D) Quantitative analyses of H3K9 acetylation level in A–C”’. (lymph glands n = 15 for each genotype, P-values from left to right 0.945, < .001, < .001, < .001 and < .001, respectively). (E-H) Feeding the larvae with acetate supplementation rescued the halt in differentiation: crystal cell number (H) in Rel overexpression, which was otherwise observed in progenitor-specific Rel overexpression (F) and is now comparable to that of control (E). Compared to control (E) the number of crystal cells is unaltered in larvae fed on acetate supplemented food (G). (I) Crystal cell index in the genotypes with acetate treatments E-H (lymph gland n≥10, P-values from left to right = 0.861, <0.001, = 0.999 and <0.001, respectively). Genotypes are as mentioned. Each dot in the graph represents individual values, Data expressed as mean ±SD. Statistical analysis: Tukey’s multiple comparison tests. P-Value of <0.05, <0.01 and<0.001, mentioned as *, **, *** respectively. Scale bar: 20μ, DAPI: nucleus.

