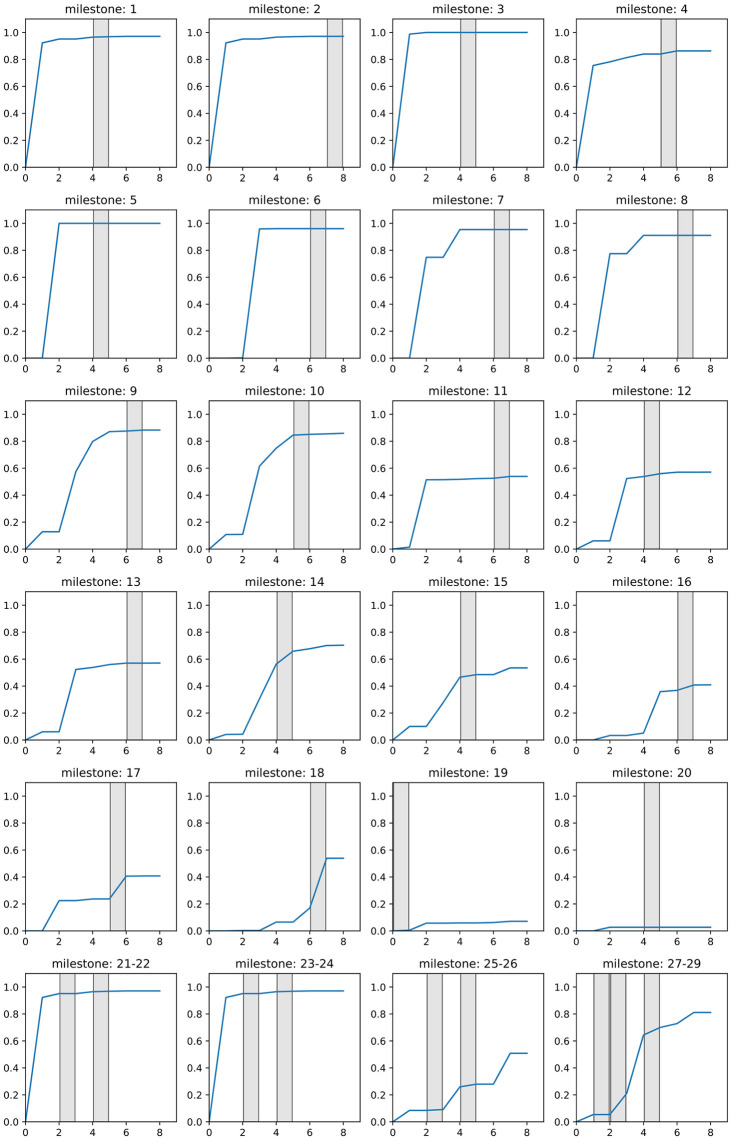
Fig 9. Temporal activation probability of the road segments around the milestones.
Milestones that were found in the same location are grouped in one image. The time frames the respective milestones were found are marked in grey. Roman roads network lines reproduced with permission from Ancient World Mapping Center [60] under a CC BY licence, original copyright 2015.

