
Fig. 1.
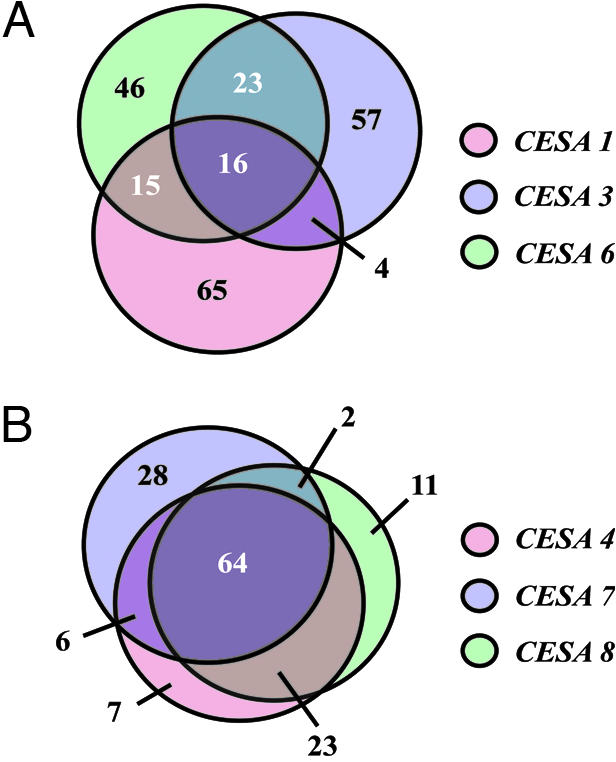
Venn diagrams show overlapping coexpressed genes for the 100 highest ranked genes with the individual CESA genes for the primary (A) and secondary (B) CESA complexes.
Official websites use .gov
A
.gov website belongs to an official
government organization in the United States.
Secure .gov websites use HTTPS
A lock (
) or https:// means you've safely
connected to the .gov website. Share sensitive
information only on official, secure websites.
Venn diagrams show overlapping coexpressed genes for the 100 highest ranked genes with the individual CESA genes for the primary (A) and secondary (B) CESA complexes.