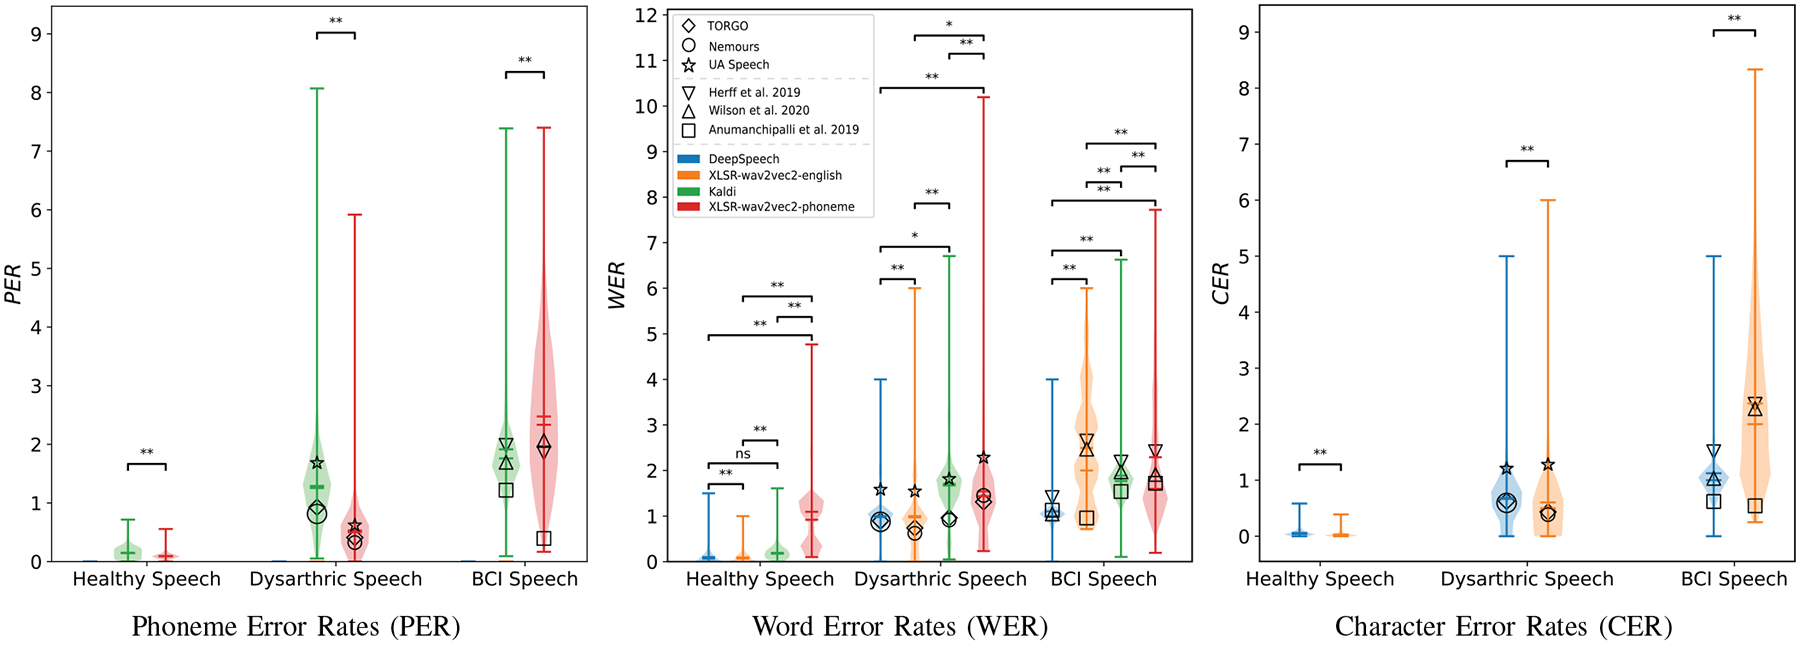
Fig. 3. Candidate Model Performance.

Violin plots show the distribution of performance across all utterances, with colored horizontal lines showing the distribution mean and median. WER is defined as the number of edits (insertion, substitution or deletion) of words in the output of the model to reach the intended sentence. CER and PER are defined in the same way but for characters and phonemes in a sentence, respectively. Note that PER, WER, and CER can be above 1, but any value approaching 1 (or higher) implies that the speech is not intelligible to this model. The black symbols represent the mean error rates of the corresponding individual datasets for that column’s model. The healthy speech has only one dataset, Librispeech. (ns: p-value >= 0.01, *: p-value < 0.01, **: p-value < 0.005)
