Figure 2.
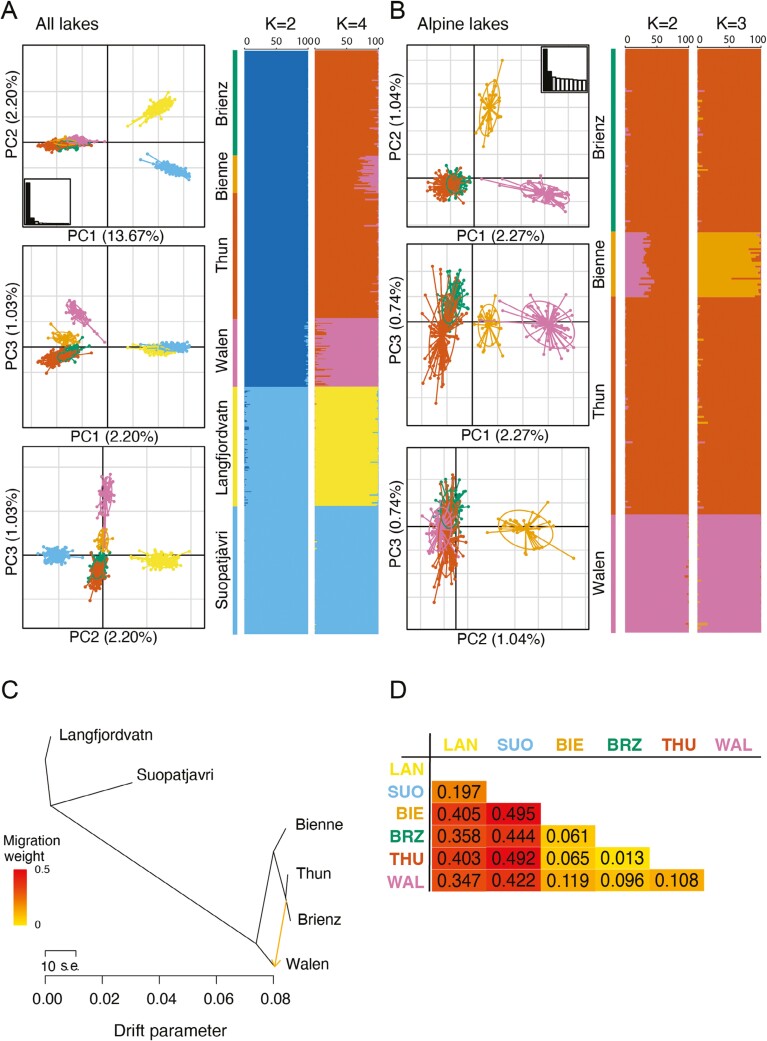
Proteocephalus fallax population genetic structure across (A) all lakes based on 2,002 shared SNPs, and (B) perialpine lakes based on 6,121 shared SNPs. The best number of genetic clusters (K) is given for each subset. (C) Phylogenetic network of the historical relationships among the populations inferred by Treemix. Putative gene flow is identified by an arrow pointing in the direction of the recipient population and colored proportionally to the gene flow intensity. (D) Pairwise FST matrix for all population comparisons. Colors are proportional to the degree of divergence and correspond to FST values.

