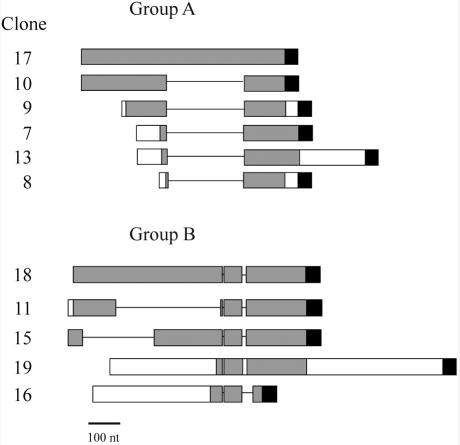
Figure 3.
Homologies among the cloned transcripts. Two groups of sequences with high homology were found (A and B). Blocks with 100% or near 100% homology are shown in gray, white rectangles represent sequences with <95% homology, lines represent gaps and black boxes stand for the polyA tail. Bar, 100 nt.

