
Figure 2.
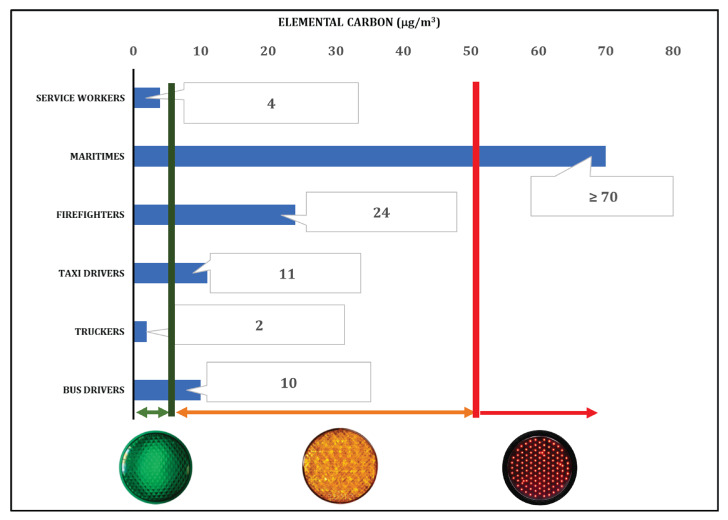
Mean air concentration for EC for exposed and unexposed workers (blue bars) (Data from Pronk, 2009) [35] and the general population (green line). The red line refers to the Italian OEL.
Official websites use .gov
A
.gov website belongs to an official
government organization in the United States.
Secure .gov websites use HTTPS
A lock (
) or https:// means you've safely
connected to the .gov website. Share sensitive
information only on official, secure websites.
Mean air concentration for EC for exposed and unexposed workers (blue bars) (Data from Pronk, 2009) [35] and the general population (green line). The red line refers to the Italian OEL.