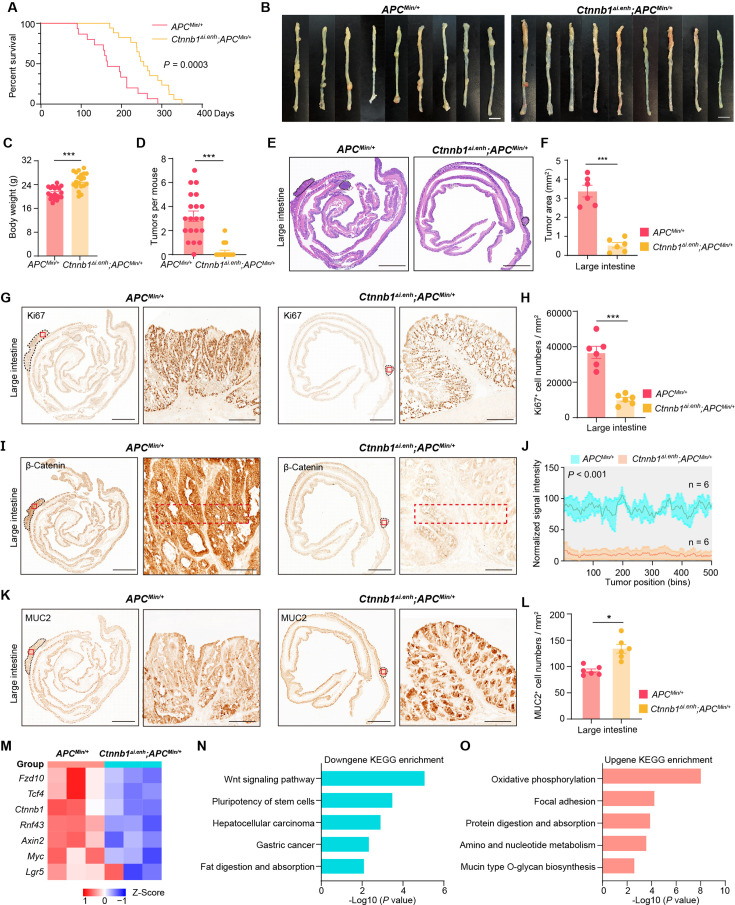
Figure 3. Knocking out ieCtnnb1 inhibits tumorigenesis of colorectal cancer.
(A) Survival of ApcMin/+ (n=15) and Ctnnb1Δi.enh;ApcMin/+ (n=17) mice. (B) Colon images of 5-month-old ApcMin/+ (n=9) and Ctnnb1Δi.enh;ApcMin/+ (n=9) mice. (C) Weight statistics of 5-month-old ApcMin/+ (n=20) and Ctnnb1Δi.enh;ApcMin/+ (n=20) mice. (D) The statistical analysis of tumor counts in colons of 5-month-old ApcMin/+ (n=9) and Ctnnb1Δi.enh;ApcMin/+ (n=9) mice. (E) Representative H&E staining images of colon sections of 5-month-old ApcMin/+ and Ctnnb1Δi.enh;ApcMin/+ mice. (F) The statistical analysis of colon tumor area in 5-month-old ApcMin/+ (n=6) and Ctnnb1Δi.enh;ApcMin/+ (n=6) mice. (G–H) Immunohistochemistry (G) and quantification (H) of Ki67+ cells in colon tumors of 5-month-old ApcMin/+ (n=6) and Ctnnb1Δi.enh;ApcMin/+ (n=6) mice. (I–J) Immunohistochemistry (I) and signal intensity statistics (J, red dashed boxes of I) of β-catenin in colon tumors of 5-month-old ApcMin/+ (n=6) and Ctnnb1Δi.enh;ApcMin/+ (n=6) mice. (K–L) Immunohistochemistry (K) and quantification (L) of MUC2+ cells in colon tumors of 5-month-old ApcMin/+ (n=6) and Ctnnb1Δi.enh;ApcMin/+ (n=6) mice. (M) The heatmap showing relative expressions of Wnt signaling pathway genes of colon tumors from 5-month-old ApcMin/+ (n=3) and Ctnnb1Δi.enh;ApcMin/+ (n=3) mice. (N–O) KEGG analyses of downregulated (N) and upregulated (O) genes in colon tumors of 5-month-old ApcMin/+ (n=3) and Ctnnb1Δi.enh;ApcMin/+ (n=3) mice. Scale bars, 1 cm (B), 4 mm (E, G, I, and K), 200 μm (magnified views in G and K), 100 μm (magnified views in I). Quantification data are shown as means ± SEM, statistical significance was determined using an unpaired two-tailed Student’s t-test (C, D, F, H, J, and L) or log-rank analysis (A). *p<0.05, **p<0.01, ***p<0.001, and ****p<0.0001. ns, not significant.


