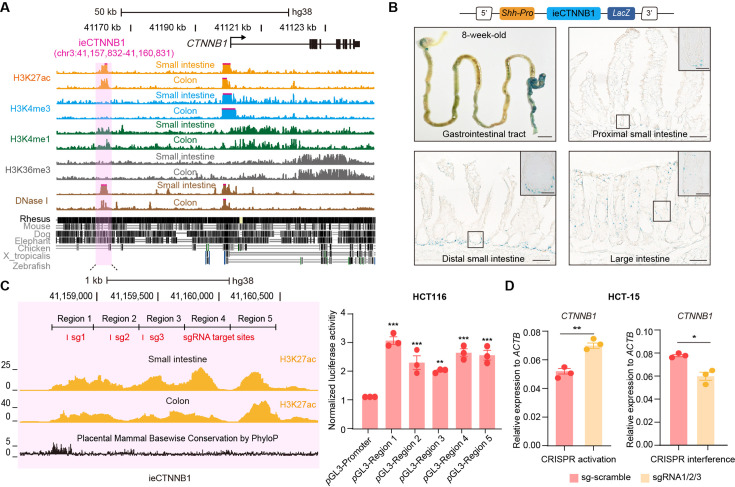
Figure 4. ieCTNNB1 is the intestinal enhancer of human CTNNB1.
(A) Schematic representation of human CTNNB1 gene and the location of ieCTNNB1 (3,000 bp, pink shading), which is marked by H3K27ac and H3K4me1 peaks, and DNaseI hypersensitivity in human small intestine (30-year-old female) and colon (34-year-old male). Data were obtained from ENCODE. (B) Top: a schematic illustration showing that the knock-in construct containing the Shh promoter, ieCTNNB1 sequences (3,000 bp), and the LacZ reporter gene. Bottom: X-Gal staining (blue) of the gastrointestinal tract, and sections of the proximal small intestine, distal small intestine, and large intestine in 8-week-old H11hi.enh mice. (C) Left: ieCTNNB1 is marked by enrichment of H3K27ac in human small intestine (30-year-old female) and colon (34-year-old male). Data were obtained from ENCODE. Locations of single-guide RNA (sgRNA) target sites were indicated. Five subregions of ieCTNNB1 were shown. Right: luciferase reporter assay in HCT116 cells transfected with indicated plasmids for 48 hr. (D) Quantitative reverse transcription PCR (RT-qPCR) showing relative mRNA levels of CTNNB1 in HCT-15 cells transfected with indicated CRISPR activation or CRISPR interference vectors for 48 hr. Scale bars, 1 cm (whole mount in B), 100 μm (sections in B), 10 μm (magnified views in B). Quantification data are shown as means ± SEM, statistical significance was determined using one-way ANOVA (C) and an unpaired two-tailed Student’s t-test (D). *p<0.05, **p<0.01, ***p<0.001, and ****p<0.0001. ns, not significant.


