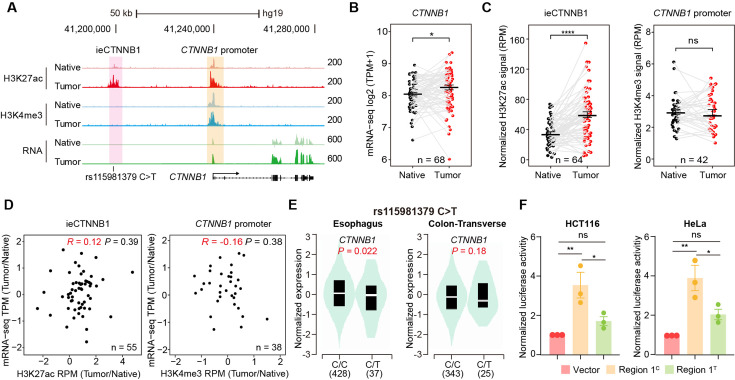
Figure 5. ieCTNNB1 is activated in colorectal cancer and its activity positively correlates with the expression of CTNNB1.
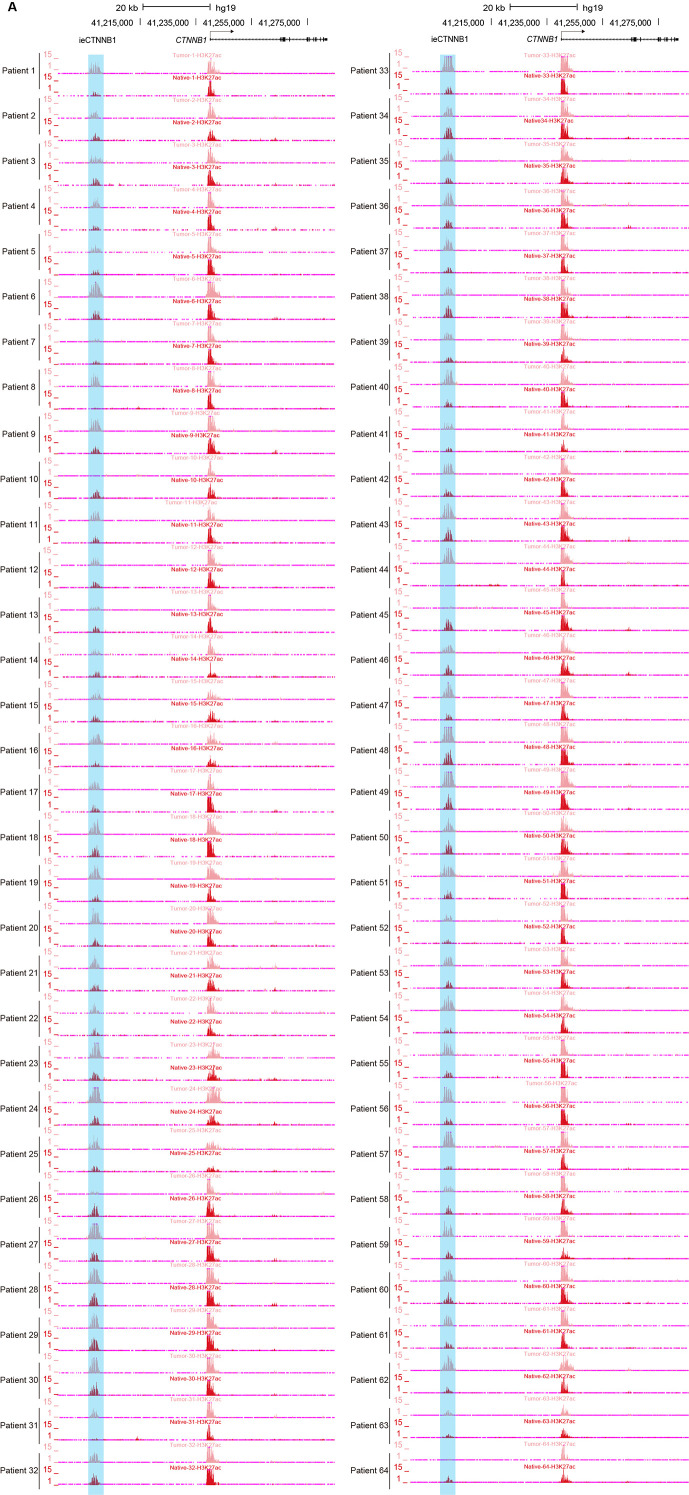
(A) Schematic representation of ieCTNNB1 (pink shading) and CTNNB1 promoter (yellow shading), which is respectively marked by H3K27ac and H3K4me3 peaks, and mRNA signals in native and tumor tissues of a patient with colorectal cancer. The location of risk mutation site was indicated. (B) Comparison of CTNNB1 expression levels in native and tumor tissues of colorectal cancer patients (n=68). (C) Left: comparison of H3K27ac signals at ieCTNNB1 in native and tumor tissues of colorectal cancer patients (n=64). Right: comparison of H3K4me3 signals at CTNNB1 promoter in native and tumor tissues of colorectal cancer patients (n=42). (D) Left: correlation between H3K27ac signals at ieCTNNB1 and CTNNB1 expression in native and tumor tissues of colorectal cancer patients (n=55). Right: correlation between H3K4me3 signals at CTNNB1 promoter and CTNNB1 expression in native and tumor tissues of colorectal cancer patients (n=38). (E) Left: comparison of CTNNB1 expression in esophagus between subjects with common sequence (C/C, n=428) and variant sequence (C/T, n=37). Right: comparison of CTNNB1 expression in transverse colon between subjects with common sequence (C/C, n=343) and variant sequence (C/T, n=25). (F) Luciferase reporter assay in HCT116 and HeLa cells transfected with indicated plasmids for 48 hr. Quantification data are shown as means ± SEM, statistical significance was determined using a paired (B, C, and D) or unpaired (E) two-tailed Student’s t-test and two-way ANOVA (F). *p<0.05, **p<0.01, ***p<0.001, and ****p<0.0001. ns, not significant. R: Pearson correlation.


