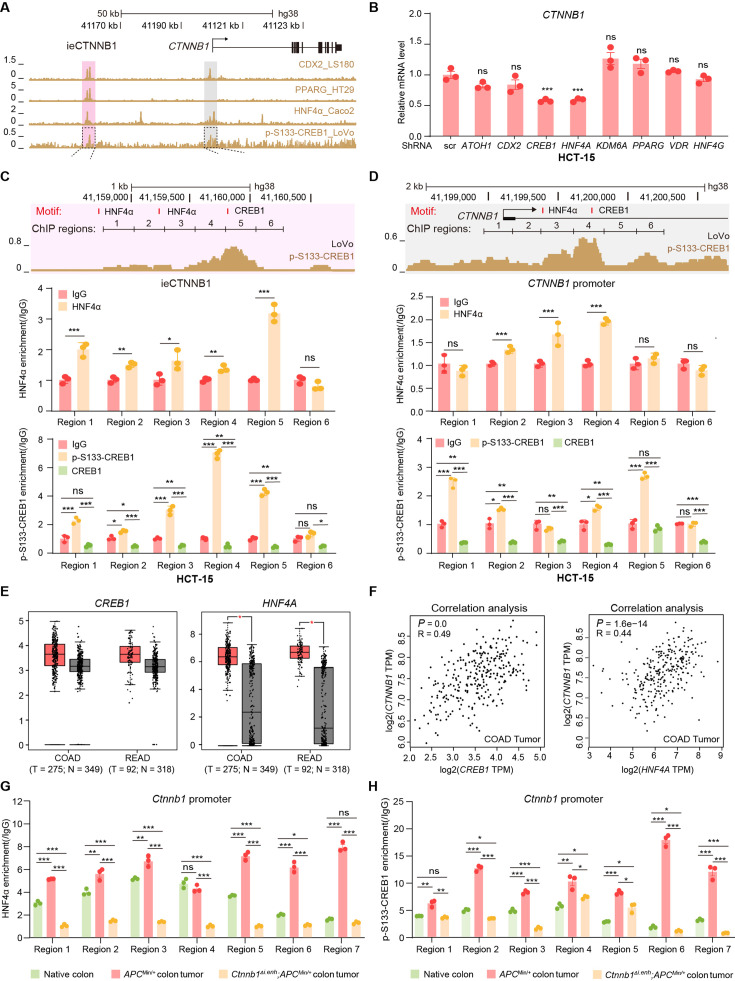
Figure 6. HNF4α and p-S133-CREB1 associate with ieCTNNB1 to regulate CTNNB1’s transcription.
(A) Chromatin immunoprecipitation sequencing (ChIP-seq) tracks of indicated trans-acting factors enriched at ieCTNNB1 (pink shading) and CTNNB1 promoter (gray shading) in indicated colorectal cancer cell lines. Shaded regions were enlarged in C (pink) and D (gray) respectively. (B) Quantitative reverse transcription PCR (RT-qPCR) showing relative mRNA levels of CTNNB1 in HCT-15 cells transfected with indicated shRNA-expressing plasmids for 48 hr. The expression level of CTNNB1 in cells transfected with scramble (scr) shRNA was set to ‘1’. (C–D) Top: schematic diagram showing the enrichment of p-S133-CREB1 at ieCTNNB1 (C) and CTNNB1’s promoter (D). Locations of HNF4α and CREB1 binding motif sites were indicated. Middle and bottom: ChIP-qPCR showing enrichment of HNF4α (middle), CREB1 and p-S133-CREB1 (bottom) at ieCTNNB1 (C), and CTNNB1’s promoter (D) in HCT-15 cells. Locations of ChIP regions were indicated. (E) Comparison of expression levels of CREB1 and HNF4A between native and tumor tissues in colon adenocarcinoma (COAD) and rectum adenocarcinoma (READ) tumors. (F) Correlations between the expression level of CTNNB1 and those of CREB1 or HNF4A in COAD tumors. (G–H) ChIP-qPCR showing enrichment of HNF4α (G) and p-S133-CREB1 (H) at Ctnnb1 promoter in native colon tissues of WT (n= 3) mice, tumor tissues of ApcMin/+ (n= 3) mice, and Ctnnb1Δi.enh;ApcMin/+ (n= 3) mice. Quantification data are shown as means ± SEM, statistical significance was determined using one-way ANOVA (B), unpaired two-tailed Student’s t-test (E and F), and Multiple t-tests – one per row (C, D, G, and H). *p<0.05, **p<0.01, ***p<0.001, and ****p<0.0001. ns, not significant. R: Pearson correlation.


