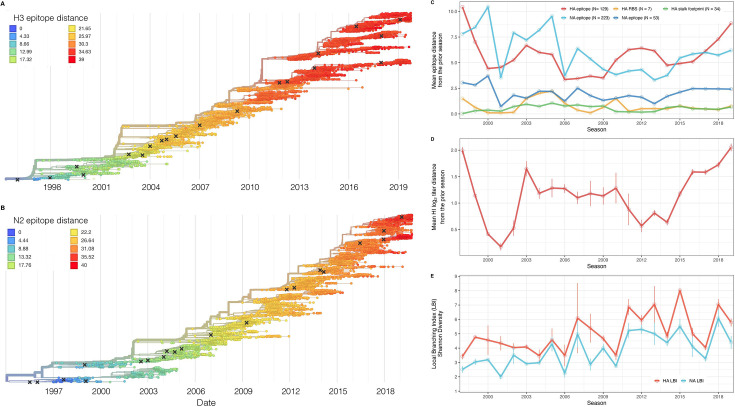
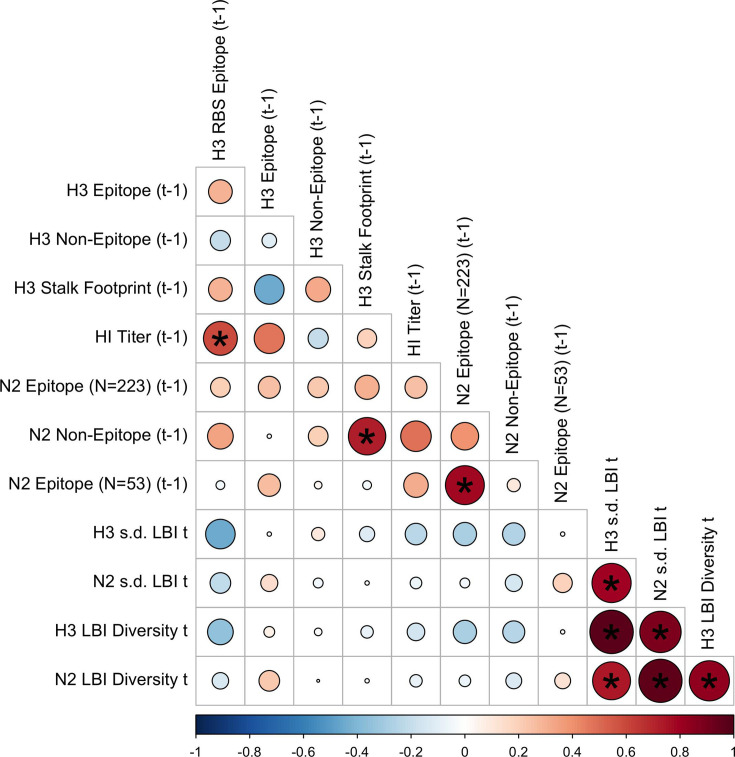
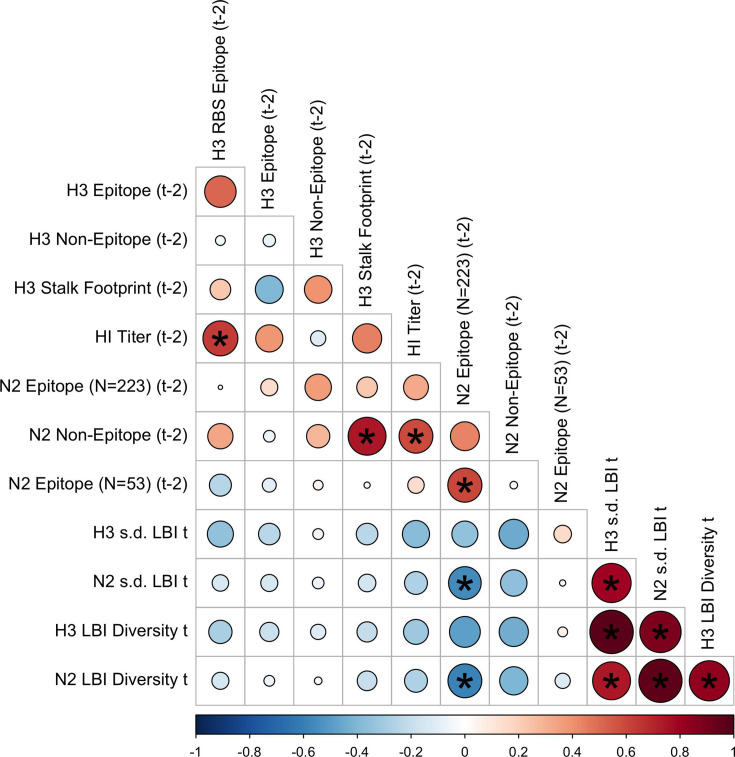
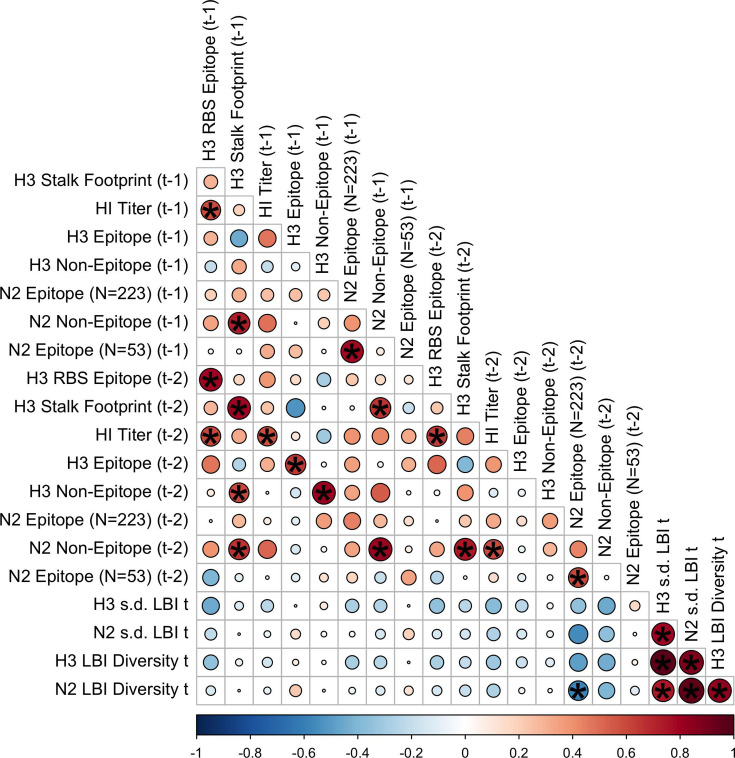
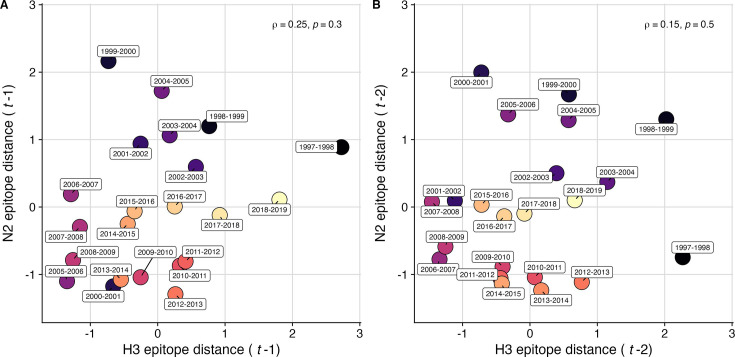
Figure 2. Antigenic and genetic evolution of seasonal influenza A(H3N2) viruses, 1997 – 2019.
(A–B) Temporal phylogenies of (A) hemagglutinin (H3) and (B) neuraminidase (N2) gene segments. Tip color denotes the Hamming distance from the root of the tree, based on the number of substitutions at epitope sites in H3 (N=129 sites) and N2 (N=223 sites). Black ‘X’ marks indicate the phylogenetic positions of U.S. recommended vaccine strains. (C–D) Seasonal genetic and antigenic distances are the mean distance between A(H3N2) viruses circulating in the current season and viruses circulating in the prior season ( – 1), measured by (C) five sequence-based metrics (HA epitope (N=129), HA receptor binding site (RBS) (N=7), HA stalk footprint (N=34), NA epitope (N=223 or N=53)) and (D) hemagglutination inhibition (HI) titer measurements. (E) The Shannon diversity of H3 and N2 local branching index (LBI) values in each season. Vertical bars in (C), (D), and (E) are 95% confidence intervals of seasonal estimates from five bootstrapped phylogenies.

