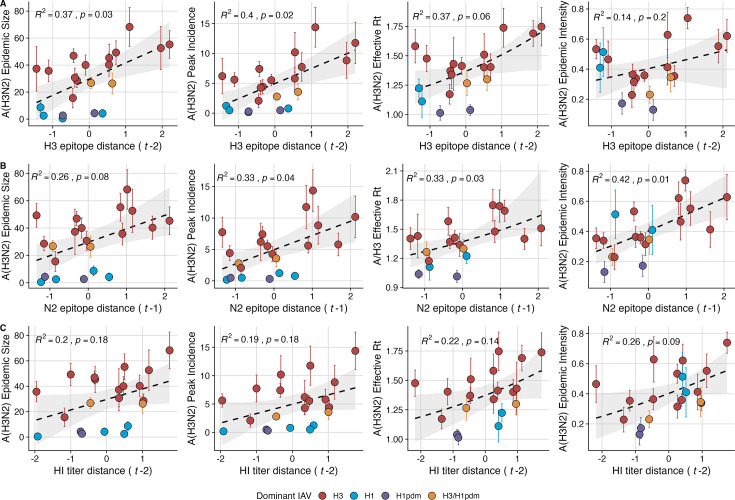
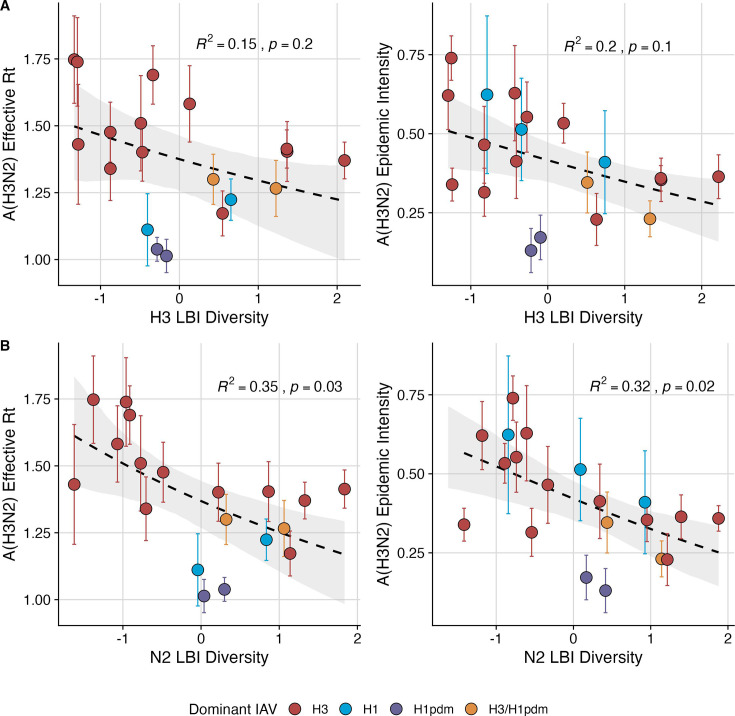
Figure 3. Influenza A(H3N2) antigenic drift correlates with larger, more intense annual epidemics.
A(H3N2) epidemic size, peak incidence, transmissibility (effective reproduction number, ), and epidemic intensity increase with antigenic drift, measured by (A) hemagglutinin (H3) epitope distance, (B) neuraminidase (N2) epitope distance, and (C) hemagglutination inhibition (HI) log2 titer distance. Seasonal antigenic drift is the mean titer distance or epitope distance between viruses circulating in the current season and viruses circulating in the prior season ( – 1) or two prior seasons ago ( – 2). Distances are scaled to aid in direct comparison of evolutionary indicators. Point color indicates the dominant influenza A virus (IAV) subtype based on CDC influenza season summary reports (red: A(H3N2), blue: A(H1N1), purple: A(H1N1)pdm09, orange: A(H3N2)/A(H1N1)pdm09 co-dominant), and vertical bars are 95% confidence intervals of regional estimates (pre-2009 seasons: 9 regions; post-2009 seasons: 10 regions). Seasonal mean A(H3N2) epidemic metric values were fit as a function of antigenic or genetic distance using LMs (epidemic size, peak incidence), Gaussian GLMs (effective : inverse link), or Beta GLMs (epidemic intensity: logit link) with 1000 bootstrap resamples. In each plot, the black dashed line represents the mean regression fit, and the gray shaded band shows the 95% confidence interval, based on 1000 bootstrap resamples. The R2 and associated p-value from the mean regression fit are in the top left section of each plot.

