. 2024 Sep 25;13:RP91849. doi: 10.7554/eLife.91849

Figure 5. Influenza A(H3N2) seasonal duration increases with the diversity of hemagglutinin (H3) and neuraminidase (N2) clade growth rates in each season.

Seasonal diversity of clade growth rates is measured as the (A) Shannon diversity or (B) standard deviation (s.d.) of H3 and N2 local branching index (LBI) values of viruses circulating in each season. LBI values are scaled to aid in direct comparisons of different LBI diversity metrics. Point color indicates the dominant influenza A subtype based on CDC influenza season summary reports (red: A(H3N2), blue: A(H1N1), purple: A(H1N1)pdm09, orange: A(H3N2)/A(H1N1)pdm09 co-dominant), and vertical bars are 95% confidence intervals of regional estimates (pre-2009 seasons: 9 regions; post-2009 seasons: 10 regions). Mean seasonal duration was fit as a function of H3 or N2 LBI diversity using Gaussian GLMs (inverse link) with 1000 bootstrap resamples. In each plot, the black dashed line represents the mean regression fit, and the gray shaded band shows the 95% confidence interval, based on 1000 bootstrap resamples. The R2 and associated p-value from the mean regression fit are in the top left section of each plot.

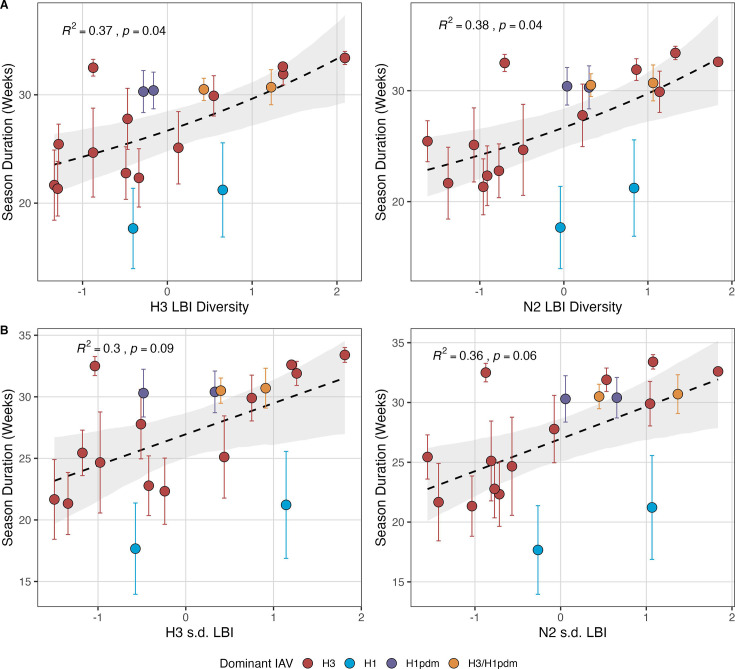
Figure 5.

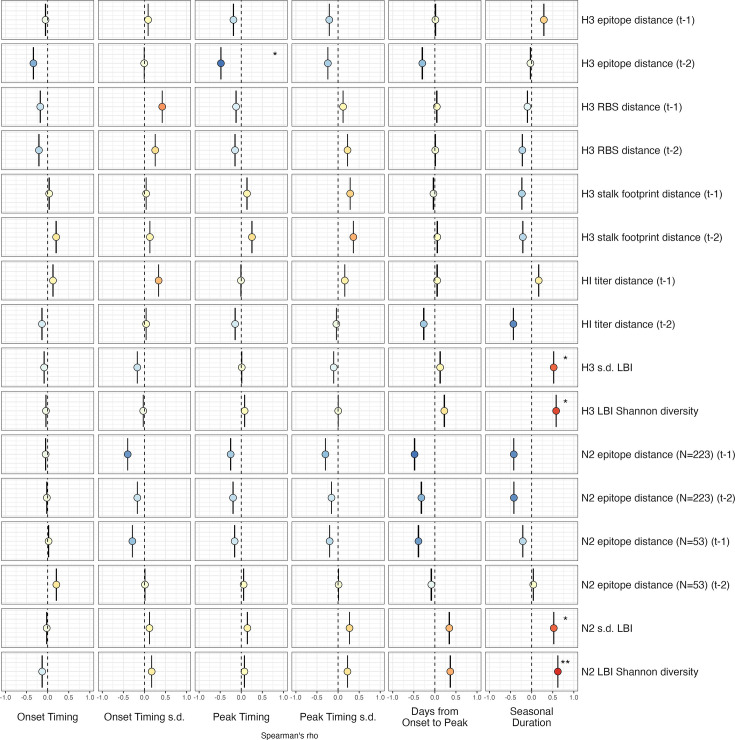
Figure 5—figure supplement 1. Univariate correlations between influenza A(H3N2) evolutionary indicators and epidemic timing.

Figure 5—figure supplement 1.

Mean Spearman’s rank correlation coefficients, 95% confidence intervals of correlation coefficients, and corresponding p-values of bootstrapped (N=1000) evolutionary indicators (columns) and epidemic timing metrics (rows). Epidemic timing metrics are the week of epidemic onset, regional variation (s.d.) in onset timing, the week of epidemic peak, regional variation (s.d.) in peak timing, the number of days between epidemic onset and peak, and seasonal duration. Color indicates the strength and direction of the association, from dark red (strong positive correlation) to dark blue (strong negative correlation), and stars indicate statistical significance (* p<0.05, ** p<0.01, *** p<0.001). Abbreviations: t – 1, one-season lag; t – 2, two-season lag; RBS, receptor binding site; HI, hemagglutination inhibition; s.d., standard deviation; LBI, local branching index.
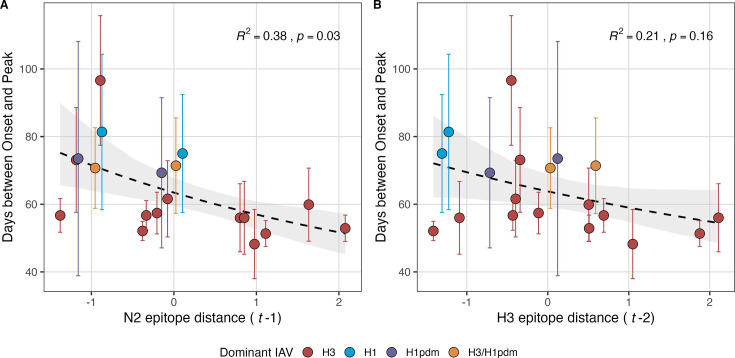
Figure 5—figure supplement 2. Epidemic speed increases with N2 antigenic drift.

Figure 5—figure supplement 2.

N2 epitope distance significantly correlates with fewer days from epidemic onset to peak (A), while the relationship between H3 epitope distance and epidemic speed is weaker (B). Seasonal epitope distance is the mean distance between viruses circulating in the current season t and viruses circulating in the prior season (t – 1) or two prior seasons ago (t – 2). Distances are scaled to aid in direct comparison of evolutionary indicators. Point color indicates the dominant influenza A subtype based on CDC influenza season summary reports (red: A(H3N2), blue: A(H1N1), purple: A(H1N1)pdm09, orange: A(H3N2)/A(H1N1)pdm09 co-dominant), and vertical bars are 95% confidence intervals of regional estimates (pre-2009 seasons: 9 regions; post-2009 seasons: 10 regions). The seasonal mean number of days from onset to peak was fit as a function of H3 or N2 epitope distance using Gamma GLMs (inverse link) with 1000 bootstrap resamples. In each plot, the black dashed line represents the mean regression fit, and the gray shaded band shows the 95% confidence interval, based on 1000 bootstrap resamples. The R2 and associated p-value from the mean regression fit are in the top right section of each plot.
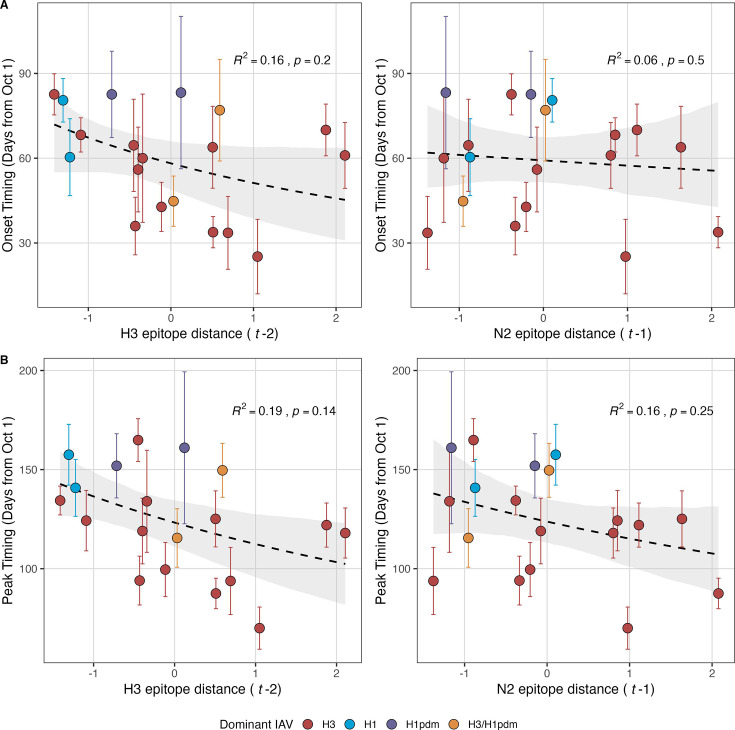
Figure 5—figure supplement 3. Influenza A(H3N2) epidemic onsets and peaks are earlier in seasons with high antigenic novelty, but correlations are not statistically significant.

Figure 5—figure supplement 3.

(A) Epidemic onsets are earlier in seasons with increased H3 epitope distance (t – 2), but the correlation is not statistically significant. (B) Epidemic peaks are earlier in seasons with increased H3 epitope distance (t – 2) and N2 epitope distance (t – 1), but correlations are not statistically significant. Seasonal epitope distance is the mean distance between viruses circulating in the current season t and viruses circulating in the prior season (t – 1) or two prior seasons ago (t – 2). Distances are scaled to aid in direct comparison of evolutionary indicators. Point color indicates the dominant influenza A subtype based on CDC influenza season summary reports (red: A(H3N2), blue: A(H1N1), purple: A(H1N1)pdm09, orange: A(H3N2)/A(H1N1)pdm09 co-dominant), and vertical bars are 95% confidence intervals of regional estimates (pre-2009 seasons: 9 regions; post-2009 seasons: 10 regions). Seasonal mean epidemic onsets and peaks were fit as a function of H3 or N2 epitope distance using Gaussian GLMs (inverse link) with 1000 bootstrap resamples. In each plot, the black dashed line represents the mean regression fit, and the gray shaded band shows the 95% confidence interval, based on 1000 bootstrap resamples. The R2 and associated p-value from the mean regression fit are in the top left section of each plot.