. 2024 Sep 25;13:RP91849. doi: 10.7554/eLife.91849

Figure 7. The effects of influenza A(H1N1) and B epidemic size on A(H3N2) epidemic burden.

(A) Influenza A(H1N1) epidemic size negatively correlates with A(H3N2) epidemic size, peak incidence, transmissibility (effective reproduction number, Rt), and epidemic intensity. (B) Influenza B epidemic size does not significantly correlate with A(H3N2) epidemic metrics. Point color indicates the dominant influenza A virus (IAV) subtype based on CDC influenza season summary reports (red: A(H3N2), blue: A(H1N1), purple: A(H1N1)pdm09, orange: A(H3N2)/A(H1N1)pdm09 co-dominant), and vertical and horizontal bars are 95% confidence intervals of regional estimates (pre-2009 seasons: 9 regions; post-2009 seasons: 10 regions). Seasonal mean A(H3N2) epidemic metrics were fit as a function of mean A(H1N1) or B epidemic size using Gaussian GLMs (epidemic size and peak incidence: inverse link; effective Rt: log link) or Beta GLMs (epidemic intensity: logit link) with 1000 bootstrap resamples. In each plot, the black dashed line represents the mean regression fit, and the gray shaded band shows the 95% confidence interval, based on 1000 bootstrap resamples. The R2 and associated p-value from the mean regression fit are in the top left section of each plot.

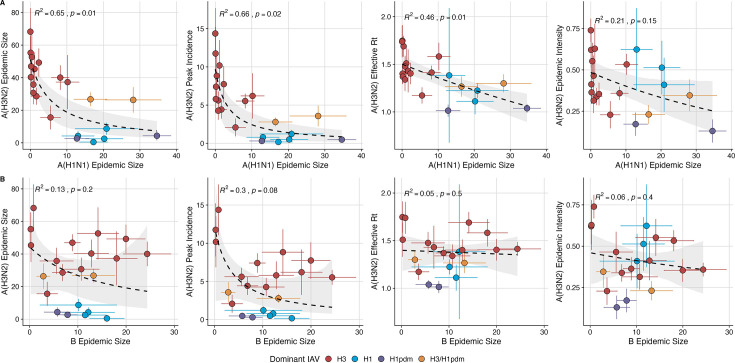
Figure 7.

Figure 7—figure supplement 1. National excess influenza A(H3N2) mortality decreases with A(H1N1) epidemic size but not B epidemic size.

Figure 7—figure supplement 1.

Relationships between seasonal excess influenza A(H3N2) mortality and the circulation of A(H1N1) or B viruses are organized by influenza type/subtype and age group: (A) A(H1N1) epidemic size and all age groups, (B) A(H1N1) epidemic size and individuals aged ≥65 years, (C) B epidemic size and all age groups, and (D) B epidemic size and individuals aged ≥65 years. Excess influenza deaths attributable to A(H3N2) (per 100,000 people) were estimated from a seasonal regression model fit to weekly pneumonia and influenza-coded deaths. Point color indicates the dominant influenza A subtype based on CDC influenza season summary reports (red: A(H3N2), blue: A(H1N1), purple: A(H1N1)pdm09, orange: A(H3N2)/A(H1N1)pdm09 co-dominant), and vertical bars are 95% confidence intervals of excess mortality model estimates. Seasonal national excess mortality estimates were fit as a function of A(H1N1) or B epidemic size using Gaussian GLMs (log link) with 1000 bootstrap resamples. In each plot, the black dashed line represents the mean regression fit, and the gray shaded band shows the 95% confidence interval, based on 1000 bootstrap resamples. The R2 and associated p-value from the mean regression fit are in the top section of each plot.
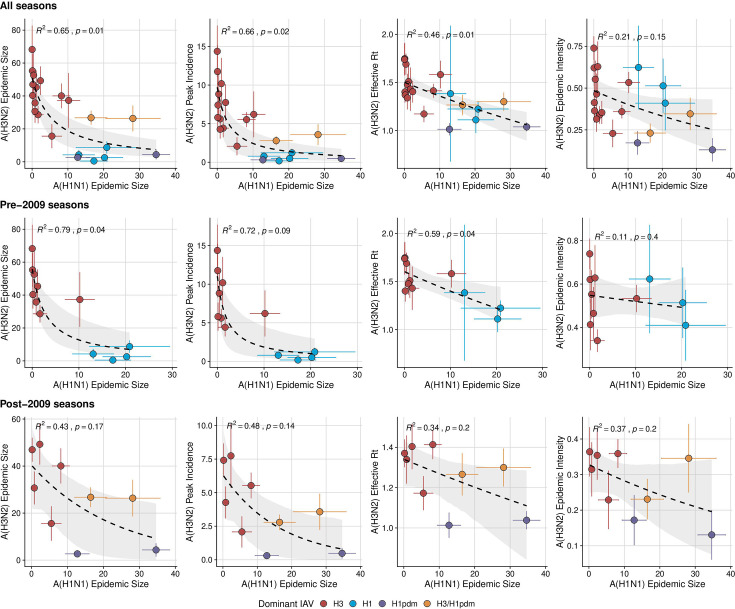
Figure 7—figure supplement 2. The effect of influenza A(H1N1) epidemic size on A(H3N2) epidemic burden during the entire study period, pre-2009 seasons, and post-2009 seasons.

Figure 7—figure supplement 2.

Influenza A(H1N1) epidemic size negatively correlates with A(H3N2) epidemic size, peak incidence, transmissibility (maximum effective reproduction number, Rt), and epidemic intensity during (A) the entire study period (1997 – 2019), (B) pre-2009 seasons, and (C) post-2009 seasons. Point color indicates the dominant influenza A virus (IAV) subtype based on CDC influenza season summary reports (red: A(H3N2), blue: A(H1N1), purple: A(H1N1)pdm09, orange: A(H3N2)/A(H1N1)pdm09 co-dominant), and vertical and horizontal bars are 95% confidence intervals of regional estimates (pre-2009 seasons: 9 regions; post-2009 seasons: 10 regions). Seasonal mean A(H3N2) epidemic metrics were fit as a function of A(H1N1) epidemic size using Gaussian GLMs (epidemic size, peak incidence: inverse link; effective Rt: log link) or Beta GLMs (epidemic intensity: logit link) with 1000 bootstrap resamples. In each plot, the black dashed line represents the mean regression fit, and the gray shaded band shows the 95% confidence interval, based on 1000 bootstrap resamples. The R2 and associated p-value from the mean regression fit are in the top left section of each plot.
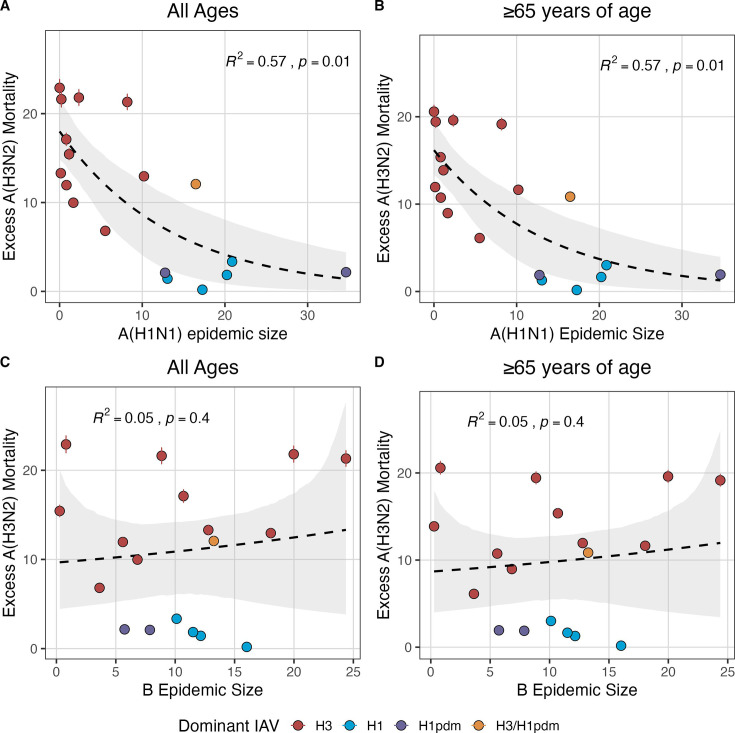
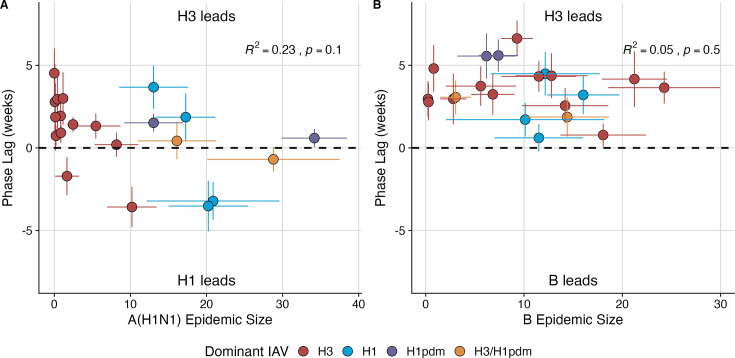
Figure 7—figure supplement 3. Wavelet analysis of influenza A(H3N2), A(H1N1), and B epidemic timing.

Figure 7—figure supplement 3.

(A) A(H3N2) incidence precedes A(H1N1) incidence in most seasons. Although A(H1N1) incidence sometimes leads or is in phase with A(H3N2) incidence (negative or zero phase lags), the direction of seasonal phase lags is not clearly associated with A(H1N1) epidemic size. (B) A(H3N2) incidence leads B incidence (positive phase lag) during every season, irrespective of B epidemic size. Point color indicates the dominant influenza A subtype based on CDC influenza season summary reports (red: A(H3N2), blue: A(H1N1), purple: A(H1N1)pdm09, orange: A(H3N2)/A(H1N1)pdm09 co-dominant), vertical bars are 95% confidence intervals (CIs) of regional phase lag estimates, and horizontal bars are 95% CIs of regional epidemic size estimates (pre-2009 seasons: 9 regions; post-2009 seasons: 10 regions). To estimate the relative timing of influenza subtype incidences, phase angle differences were calculated as phase in A(H3N2) minus phase in A(H1N1) (or B), with a positive value indicating that A(H1N1) (or B) incidence lags A(H3N2) incidence. To calculate seasonal phase lags, we averaged pairwise phase angle differences from epidemic week 40 to epidemic week 20. Seasonal phase lags were fit as a function of A(H1N1) or B epidemic size using LMs with 1000 bootstrap resamples. In each plot, the R2 and associated p-value from the mean regression fit are in the top right section, and the black dashed line shows y=0 (the two time series are in phase).