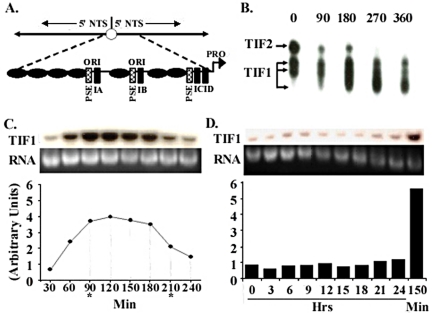
Figure 1.
TIF1 DNA binding activity and mRNA levels peak in S phase. (A) Schematic of the 21-kb palindromic rDNA minichromosome and 1.9-kb 5′ nontranscribed spacer (5′NTS; expanded diagram), including TIF1-binding sites (PSE and type I elements) and positioned nucleosomes (black ovals), and replication origins (ori) that reside in the 230 base pairs nucleosome-free regions that are part of an imperfect 430-base pair tandem duplication. (B) TIF1 DNA binding activity is cell cycle regulated. Gel shift analysis of extracts prepared from vegetative cultures synchronized by starvation and refeeding. The probe, ssA37, corresponds to the A-rich strand of the type IB element (Saha and Kapler, 2000). (C) TIF1 mRNA levels are cell cycle regulated. Northern blot analysis with an intron-spanning TIF1 coding region probe on mRNA prepared from cells synchronized by starvation and refeeding (Mohammad et al., 2000). Hybridization signals were normalized to ethidium bromide staining of the rRNA and plotted as a function of time. Asterisks demarcate the approximate beginning and end of macronuclear S phase. (D) TIF1 mRNA levels are constant throughout development. TIF1 Northern blot analysis on mRNA prepared from cells at various time points during conjugation. Developmental landmarks: 3 h: premeiotic S, 7–8 h: postzygotic S, 10–24 h: macronuclear development, including rDNA gene amplification. T = 150 min: peak TIF1 mRNA level in synchronized vegetative cell cultures.

