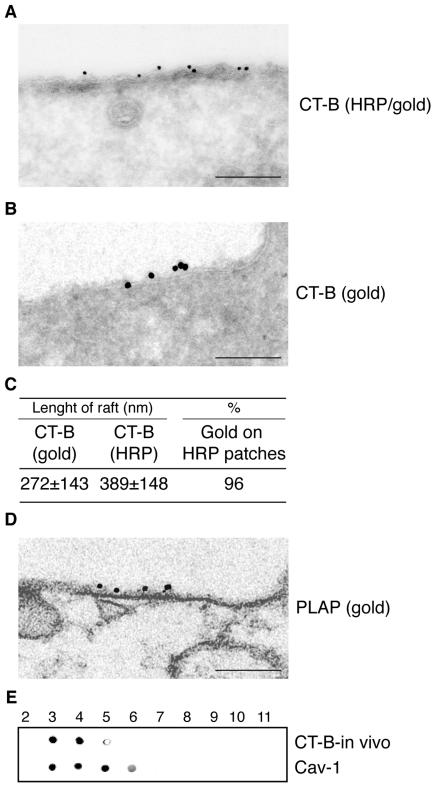
Figure 3.
Specificity of CT-B/HRP to identify GM1-rich membrane domains by electron microscopy. Starved HeLa cells cultured at 0°C for 1 h in the presence of CT-B/HRP and epidermal growth factor (A–D). (A) Cells were processed to develop the HRP staining (electron-dense staining underneath the plasma membrane), and immunogold labeled with anti-HRP antibodies on ultrathin sections. Bar, 0.22 μm. (B) Cells were not processed to develop the HRP staining and immunogold labeled with anti-HRP antibodies. Bar, 0.15 μm. (C) Morphometry of the experiment shown in A (n = 40 cell profiles). [Length of rafts], average size of GM1-rich regions identified by CT-B/HRP labeling, and measured in two ways: [CT-B(gold)], distance between the first and last gold particle in cluster labeling HRP; [CT-B(HRP)], distance between the two edges of the electron dense staining of the HRP reaction product revealing HRP. Values are expressed in nanometers ± SD. [%] indicates the percent of the total gold particles identifying HRP present on the electron-dense staining of the HRP reaction product revealing HRP, respect to the total gold present on the plasma membrane. (D) Preembedding immunogold labeling of HeLa cells, stimulated with epidermal growth factor, at 0°C for 1 h, with anti-PLAP antibodies. Morphometry of the PLAP/gold patches associated to the plasma membrane reveals lengths ranging from 91 to 431 nm (mean = 212 ± 102; n = 25). Bar: (left) 0.16 μm. (E) Starved HeLa cells cultured at 0°C for 1 h in the presence of CT-B/HRP and epidermal growth factor. Cells were processed for the isolation of DRMs, as described in Materials and Methods, followed by dot-blot analysis of the fractions. The HRP reaction was developed to reveal the in vivo bound CT-B (CT-B-in vivo), and, after stripping, immunostained with antibodies to caveolin 1 (Cav-1).

