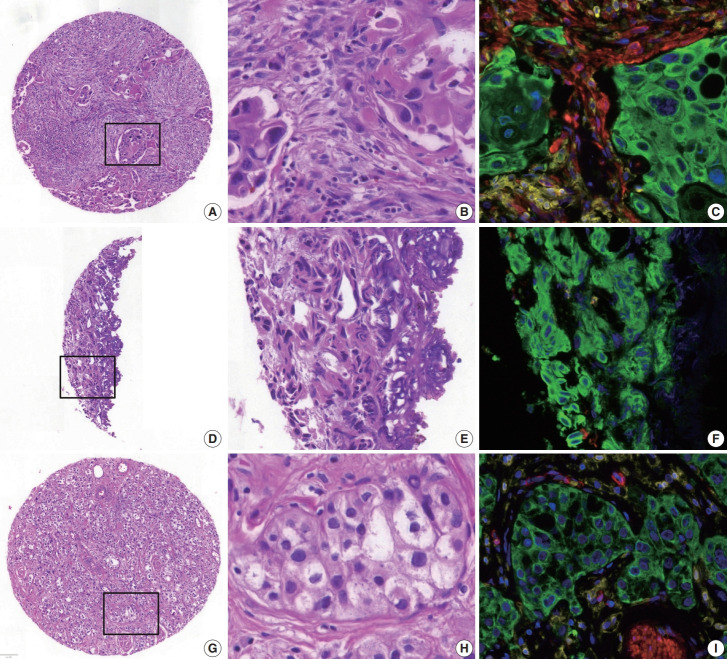
Fig. 4.
Examples of high mean absolute error cores for neoplastic cell percentage (NCP) estimation. (A–C) Abundant stroma (multiplex immunofluorescence [mIF], 28%; pathologist NCP, 5%–30%; artificial intelligence [AI] models, 23%–44%). (D–F) Cauterization artifact (mIF, 98%; pathologists, 0%–80%; AI models, 51%–76%). (G–I) Abundant cytoplasm in tumor cells (mIF, 43%; pathologists, 65%–90%; AI models, 33%–49%). B, E, and H are high-magnification images of the square inset area in A, D, and G, respectively, and the corresponding mIF images are C, F, and I, respectively. (C, F, I) Blue, DAPI; green, pan-cytokeratin; red, α-smooth muscle actin; yellow, CD45.

