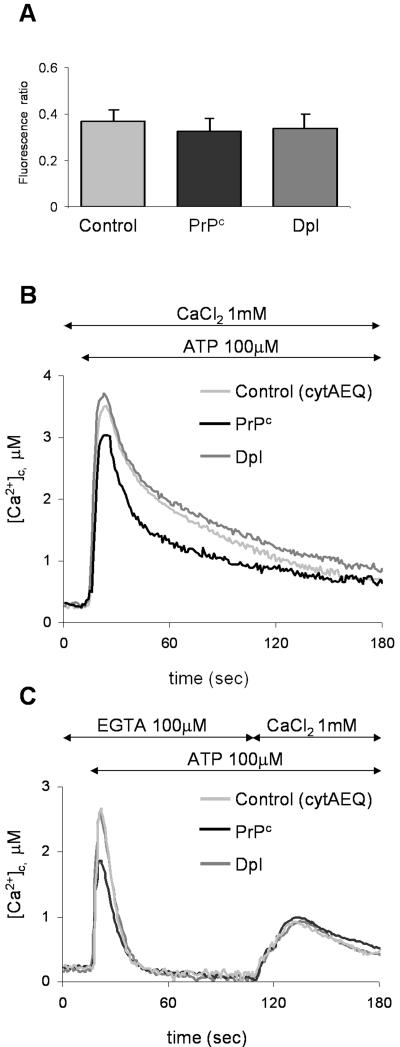
Figure 3.
Resting [Ca2+]c (A) and ATP-induced effects on [Ca2+]c (B and C), in CHO cells transiently expressing cytAEQ alone (control), or together with PrPc, or Dpl. (A) Resting [Ca2+]c, monitored by the Ca2+-indicator fura-2, is expressed as the ratio of the fluorescence emitted by fura-2 after cell excitation at 340 and 380 nm (see Materials and Methods). No statistically significant difference was found in the three cell types. (B) [Ca2+]c transients, after ATP (100 μM) addition at the indicated time point, were monitored with cytAEQ reconstituted with wild-type coelenterazine (5 μM; see Materials and Methods). Although a similar peak was found in controls (light gray trace) and Dpl-containing cells (dark gray trace), cells with PrPc (black trace) gave rise to a transient of smaller magnitude. (C) Using the above described cytAEQ, a protocol was applied so as to evaluate the contribution to the ATP-induced [Ca2+]c movements shown in B, first of the InsP3-induced Ca2+ mobilization (first peak, ATP added in the presence of 100 μM EGTA, i.e., with no external Ca2+) and then of the Ca2+ influx from the external medium (second peak, in the presence of 1 mM CaCl2). On Ca2+ release from the ER (first peak), a transient of smaller magnitude was again observed in cells with PrPc, whereas no difference in the second peak was evident in the three cell types. Presented data are typical of at least seven independent experiments, which yielded equivalent results.

