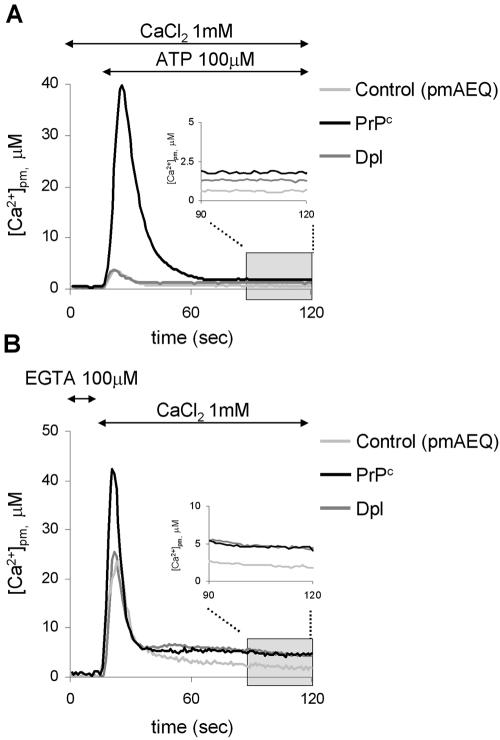
Figure 4.
Monitoring the subplasma membrane Ca2+ concentration with pmAEQ. (A) Response to ATP (100 μM) of CHO cells transiently expressing pmAEQ alone (control, light gray trace), or together with PrPc (black trace) or Dpl (dark gray trace), and maintained in 1 mM CaCl2. pmAEQ was reconstituted by incubating cells with wild-type coelenterazine (5 μM; see Materials and Methods). Addition of ATP provoked a [Ca2+]pm transient that in cells with PrPc was by far more elevated than in the other two cell types. With respect to the control, however, the resting [Ca2+] level remained significantly higher in the presence of both PrPc pmand Dpl (in the inset, resting [Ca2+]pm are reported on an expanded scale). (B) Response to CaCl2 addition (1 mM) in the same cell types described in A, but maintained in (Ca2+-free) KRB supplemented with EGTA (100 μM). After pmAEQ reconstitution, addition of 1 mM CaCl2 induced a response that mimicked that shown in A with respect to both peak and resting [Ca2+]pm levels. The latter are also shown in the inset on an expanded scale. Presented data are typical of at least six independent experiments, which yielded equivalent results.

