
Figure 4.
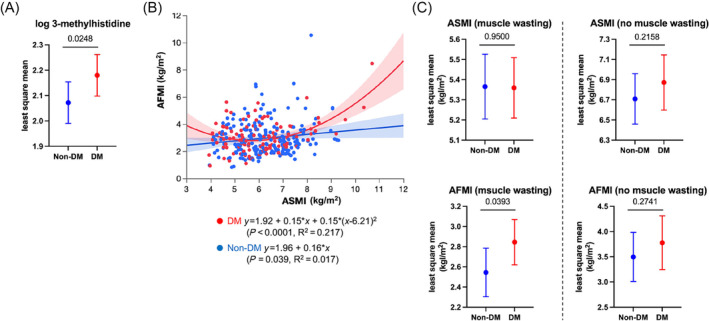
Comparison of levels of 3‐methylhistidine, a marker of myofibrillar degradation (A), correlation of ASMI with AFMI (B), and body compositions stratified by the presence of muscle wasting (C) in patients with and those without diabetes (DM). Data are presented with the least square mean (A, C), regression line or curve (B), and their 95% confidence interval. Age, gender, NYHA III or IV, ischaemic aetiology, hypertension, dyslipidaemia, and statin use were incorporated into the analysis of covariance (ANCOVA) as potential cofounders in (A) and (C). In (A), eGFR was also incorporated. The P values obtained for comparisons of the groups at both ends of the line are shown. Abbreviations are the same as those shown in the legend of Figure 3 .