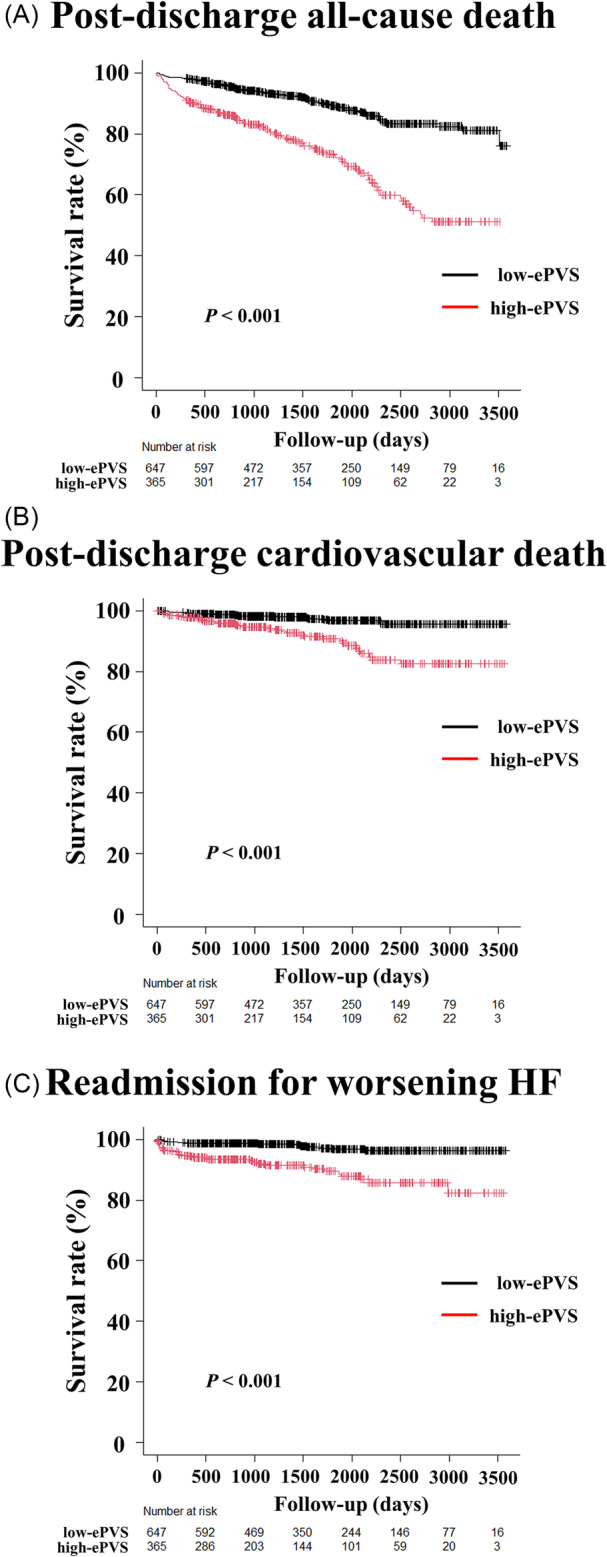
Figure 2.

Kaplan–Meier analyses of ePVS at discharge for post‐discharge all‐cause mortality, cardiovascular death, and readmission for worsening HF. The Kaplan–Meier survival curves show the time to post‐discharge all‐cause death (A), cardiovascular death (B), and HF readmission (C) in the ePVS ≤ 5.5 (low‐ePVS) and ePVS > 5.5 (high‐ePVS) groups. The log‐rank test demonstrates that the high‐ePVS group has a significantly higher rate of all‐cause death, cardiovascular death, and HF readmission than the low‐ePVS group does (log‐rank test, P < 0.001) [HR, 3.116 (95% CI, 2.311–4.202; P < 0.001); HR, 3.879 (95% CI, 2.182–6.894; P < 0.001); HR, 4.599 (95% CI, 2.542–8.321; P < 0.001), respectively]. CI, confidence interval; ePVS, estimated plasma volume status; HF, heart failure; HR, hazard ratio.
