
Figure 1.
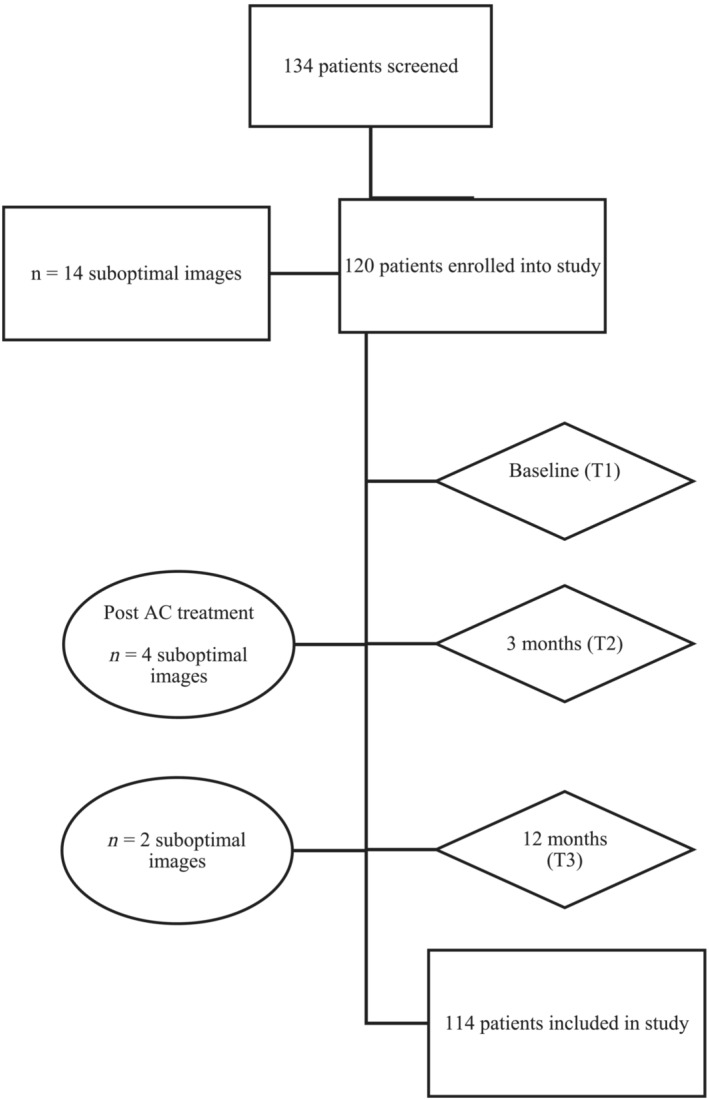
Timeline for longitudinal follow up. Flow chart of timepoints of serial echocardiograms, prior to (T1), at 3 (T2), and 12 months (T3). Patients were excluded if suboptimal image quality. AC, anthracycline.
Official websites use .gov
A
.gov website belongs to an official
government organization in the United States.
Secure .gov websites use HTTPS
A lock (
) or https:// means you've safely
connected to the .gov website. Share sensitive
information only on official, secure websites.
Timeline for longitudinal follow up. Flow chart of timepoints of serial echocardiograms, prior to (T1), at 3 (T2), and 12 months (T3). Patients were excluded if suboptimal image quality. AC, anthracycline.