Figure 2.

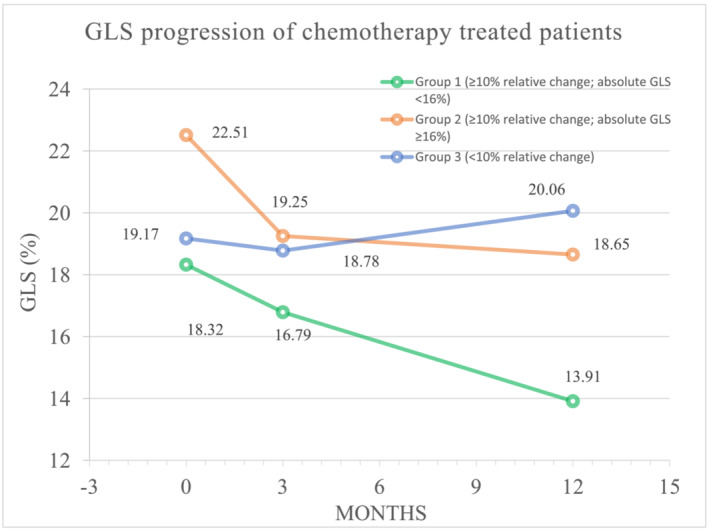
Timeline of GLS alteration in the three groups. Line graph of alterations in LV GLS between groups prior to and at 3 and 12 months post‐AC treatment. AC, anthracycline; GLS, global longitudinal strain; LV, left ventricular.

Timeline of GLS alteration in the three groups. Line graph of alterations in LV GLS between groups prior to and at 3 and 12 months post‐AC treatment. AC, anthracycline; GLS, global longitudinal strain; LV, left ventricular.