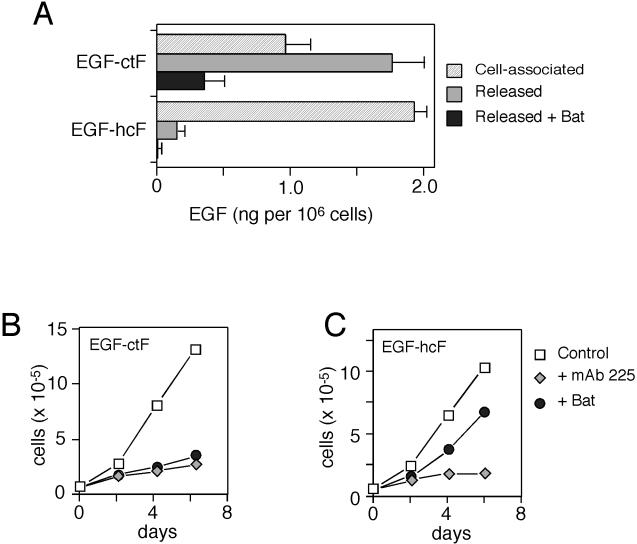
Figure 3.
Expression and activity of EGF-hcF and EGF-ctF in mammary epithelial cells. (A) Cells expressing the indicated construct were solubilized, and EGF levels were determined by ELISA. To measure released EGF, cells were incubated with mAb 225 (133 nM) in combination with or without 10 μM batimastat (Bat) for 24 h before medium was harvested and assayed. Error bars represent SD of ELISA data. (B) Cells were split 1:10 into 12-well dishes. Eighteen hours later, cells were changed to medium containing 67 mM mAb 225 or 10 μM batimastat. Medium was changed every 2 d, and cells were counted on the indicated days. Data are average of duplicate plates of cells. The data are representative of those obtained from at least three separate clonal cell lines expressing the ligand chimeras.

