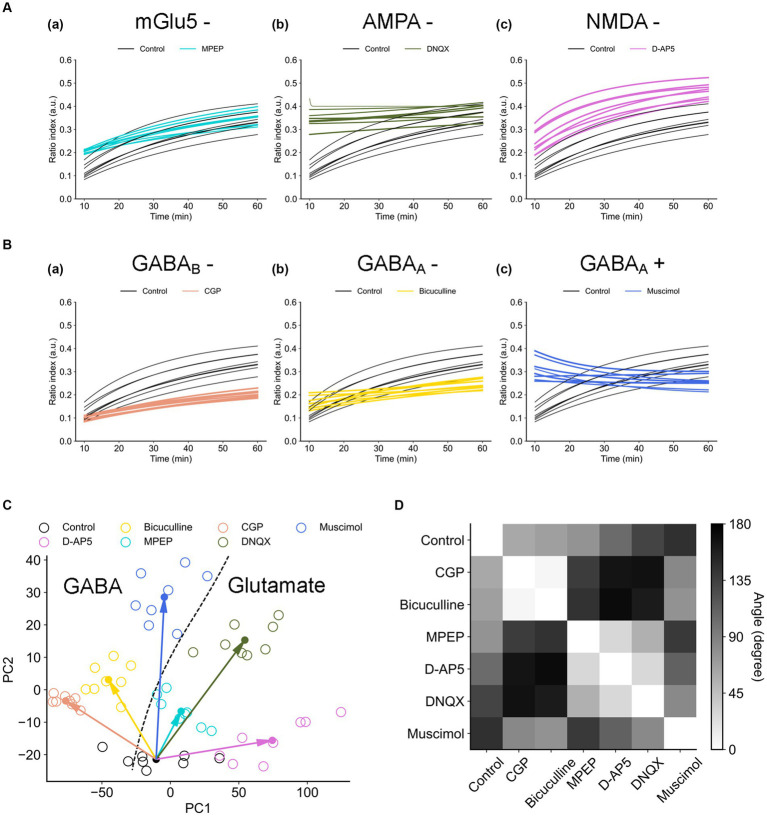
Figure 10.
Trajectories of the synaptic efficacy models with the estimated coefficients under the different drug conditions. (A) Trajectories of the glutamate group. (B) Trajectories of the GABA group. (C) Distribution of data points on the first and second principal component space (PC1 vs. PC2). The dashed line indicates the boundary between two major groups (i.e., glutamate vs. GABA groups): the glutamatergic group (i.e., D-AP5, MPEP, and DNQX) and GABAergic group (i.e., bicuculline, CGP, and muscimol). (D) The angles of the paired centroid vectors among all groups are illustrated.

