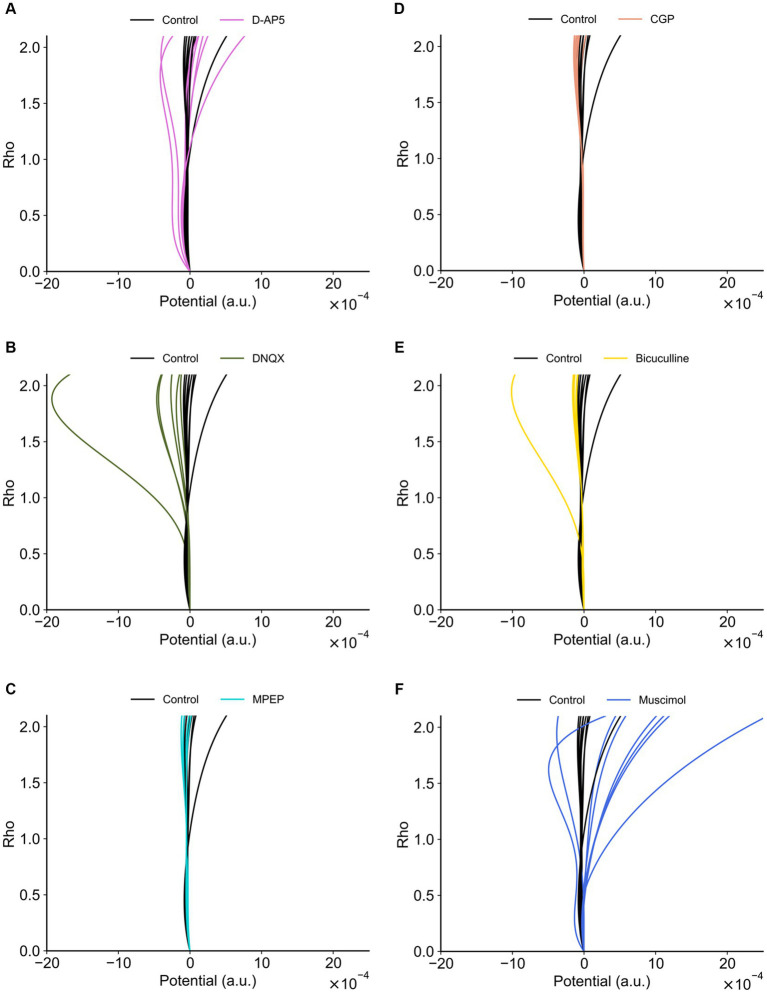
Figure 11.
Potential functions concerning the synaptic efficacy models obtained from recorded RI data sets. (A) D-AP5 vs. control conditions. (B) DNQX. (C) MPEP. (D) CGP. (E) Bicuculline. (F) Muscimol. The potential functions of the control group are also superimposed on each plot. Furthermore, in each plot, eight potential functions were individually obtained from the eight nearest electrode sites around the TS site, suggesting the spatial variability among the recording sites (electrodes).

