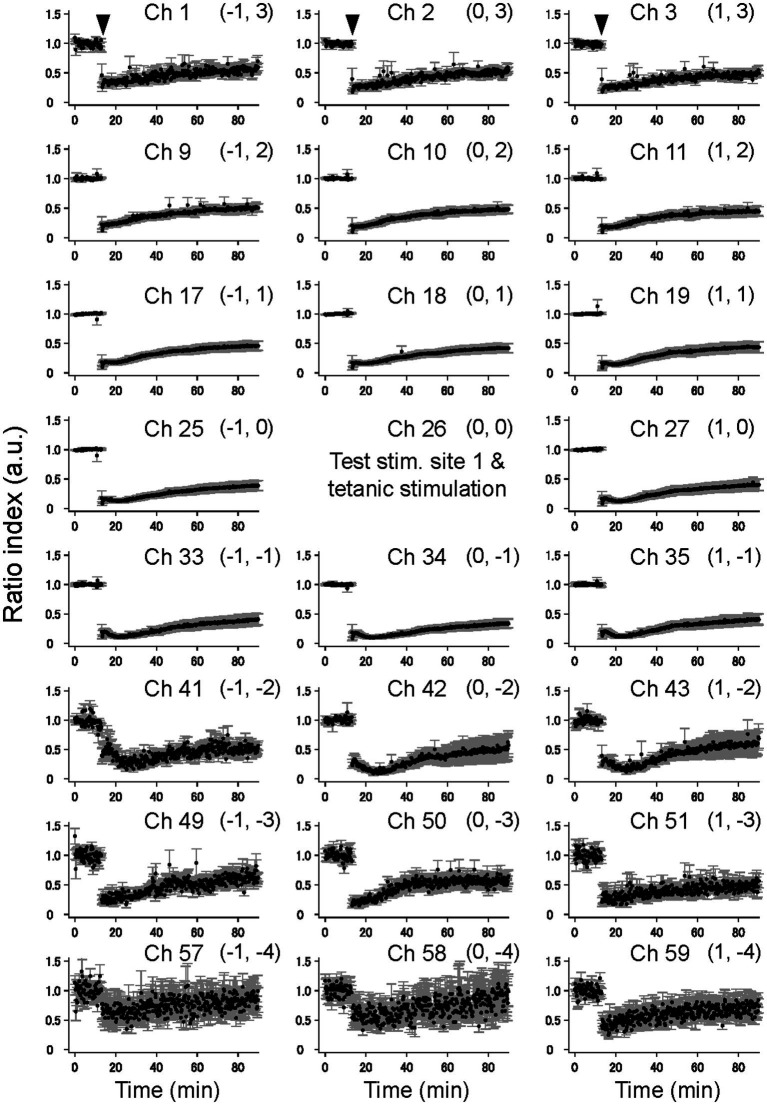
Figure 4.
The time courses of LTD in the cortical laminar layers prior and posterior to TS. The average time courses of LTD for 23 electrode sites on vertical on-line and off-line columns (c.f., Figure 1C) are illustrated on average for five brain slices (n = 5). The tetanic and test stimulation sites are represented as ch. 26, which was the spatial reference point [i.e., the origin (0, 0)] in a two-dimensional array. To express each element in the 2D matrix in the array, a bracket representation (a, b) denotes an element in the 2D matrix, where a and b, respectively, represent the row and column number relative to the origin (0, 0). The time points of TS around 10 min are indicated by inverted triangles in the first row. The error bars represent the standard mean of errors (SEMs) of normalized LFP amplitudes among the samples at the same time points.

