Figure 6.
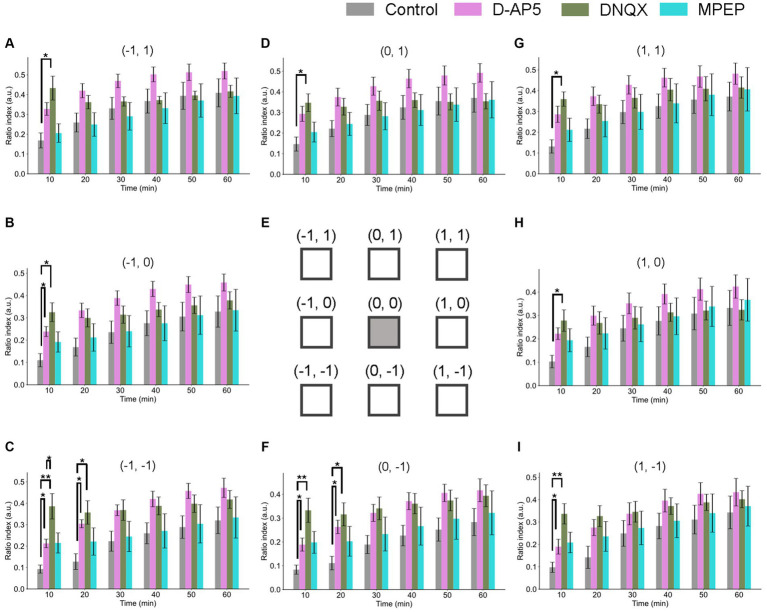
Spatiotemporal properties of LTD around the tetanic and test stimulation electrodes under the conditions of NMDA receptor, non-NMDA receptor, and metabotropic glutamate receptor 3 antagonists. Ratio indices (RIs) of evoked responses at eight recording sites around the TS site during 60 min posterior to TS under the control and the antagonists (10-μM D-AP5, 50-μM DNQX, and 50-μM MPEP) conditions. (E) schematic representation of the tetanic and test stimulation sites at position (0, 0) and the eight recording sites (−1, 1), (−1, 0), (−1, −1), (0, 1), (0, −1), (1, 1), (1, 0), and (1, −1) in a two-dimensional array representation for (A–D,F–I), respectively. Each of the inter-electrode distances (IEDs) was 150 μm. In the abscissa of each bar graph, time in minutes represents the time points after TS with a 10-min step. We used an ANOVA for multiple comparisons followed by a post-hoc Steel-Dwass test: control (n = 7), D-AP5 (n = 6), DNQX (n = 7), and MPEP (n = 6). * and ** represent p < 0.05 and p < 0.01, respectively.

