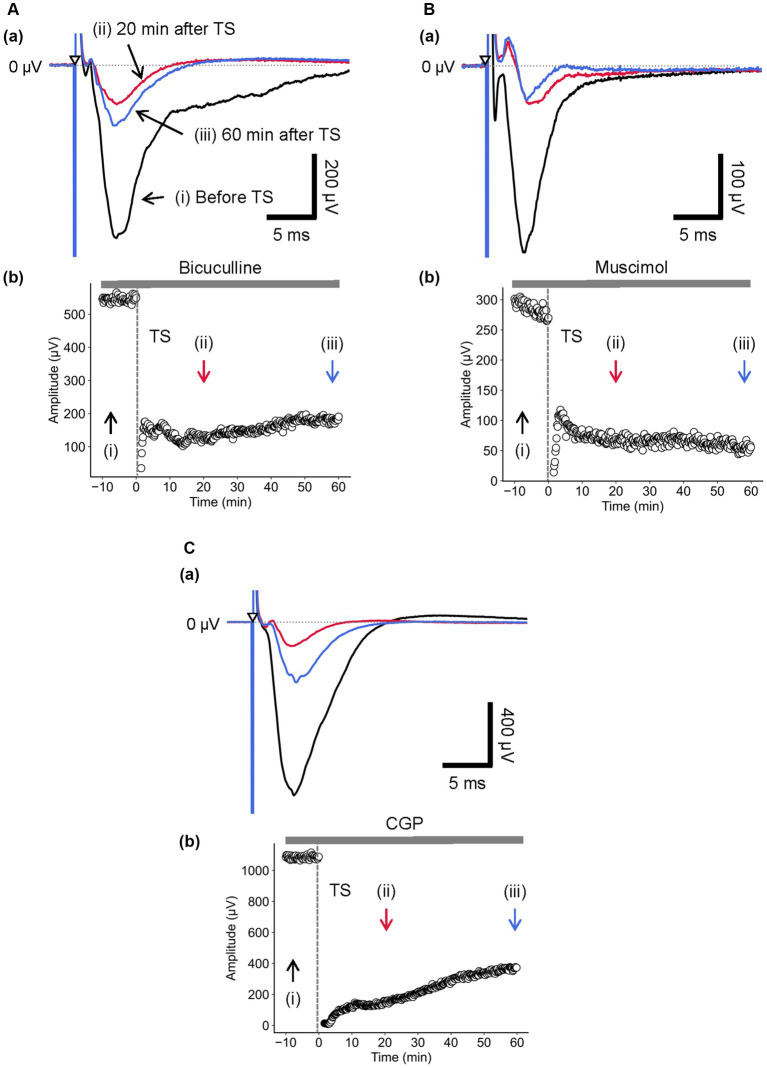
Figure 7.
Current-driven responses in layer 4 of a brain slice under the conditions of GABAA receptor antagonist/agonist and the GABAB receptor antagonist. (A) Under 5-μM bicuculline application, LFP responses were recorded in layer 4 prior and posterior to TS. Three LFP responses are illustrated (i) before (black trace), (ii) 20 min (red trace), and (iii) 60 min after TS (blue trace) applied to layer 4 in (a). The test stimuli were repetitively applied to layer 4. Time course of negative-going peak amplitudes is illustrated during the whole recording period (70 min) in (b). (B) During 5-μM muscimol application, LFP responses were recorded in layer 4 prior and posterior to TS. Three LFP responses are illustrated (i) before (black trace), (ii) 20 min (red trace), and (iii) 60 min after TS (blue trace) applied to layer 4 in (a). The test stimuli were repetitively applied to layer 4. Time course of negative-going peak amplitudes is illustrated during the whole recording period (70 min) in (b). (C) Under 5-μM CGP application, LFP responses were recorded in layer 4 before and after TS. Three LFP responses are illustrated (i) before (black trace), (ii) 20 min (red trace), and (iii) 60 min after TS (blue trace) applied to layer 4 in (a). The test stimuli were repetitively applied to layer 4. Time course of negative-going peak amplitudes is illustrated during the whole recording period (70 min) in (b). TS was applied at time 0 min in the plot (indicated by a dashed line and an arrow). The timings of a test stimulus are indicated by the inverted triangles in (a).

