Figure 9.
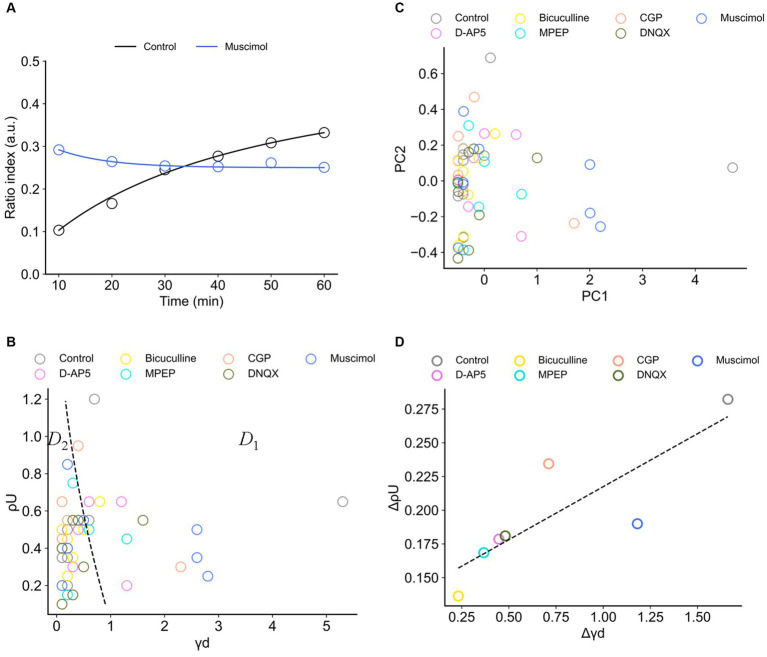
Synaptic efficacy models obtained from ratio indices (RIs) of experimental data sets. (A) Typical two examples for the fitting of RI data sets. The blue and black curves are the model trajectories obtained from muscimol and control conditions, respectively. Experimental data points are indicated by circles. (B) The distribution of two parameters, (i) the depression rates () and (ii) the unstable fixed point (), is illustrated. The dashed curve separates two regions D1 and D2. D1 (D < 0 in Equation 6) is the region where there exists only one stable fixed point, whereas D2 (D ≥ 0) is the region where there exist two stable fixed points. (C) The distribution of the data points in the first and second principal components (PC1 and PC2) of calculated coefficients in the model. (D) The scattering (variance) properties of and (i.e., and , respectively) in the analyzed eight electrode sites for each drug condition are shown.

