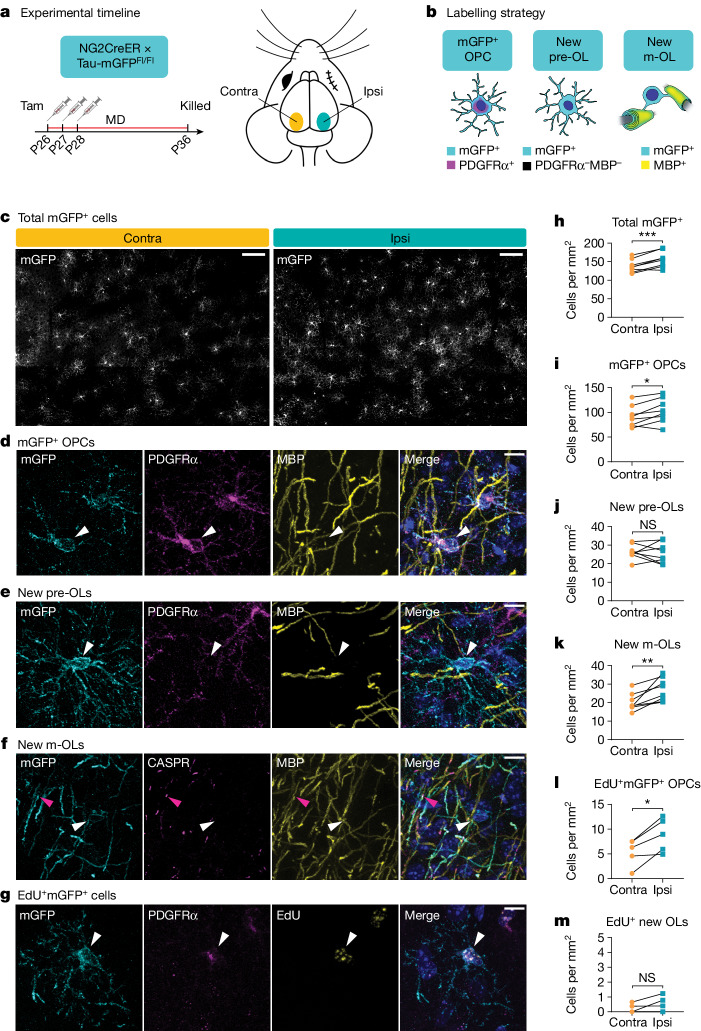
Fig. 1. Sensory experience during adolescence modulates oligodendroglial dynamics.
a, Experimental strategy and timeline. b, Labelling strategy for identification of OPCs, newly formed premyelinating oligodendrocytes (pre-OLs) and mature oligodendrocytes (m-OLs). c,h, Representative images (c) and quantification (h) of mGFP+ cells from both hemispheres of visual cortex. Two-tailed paired t-test, n = 8 mice, P = 0.0009. d,i, Example image (d) and quantification (i) of mGFP+ OPCs. Two-tailed paired t-test, n = 8 mice, P = 0.0183. e,j, Example image (e) and quantification (j) of newly formed pre-OLs. Two-tailed paired t-test, n = 8 mice, P = 0.7584. f,k, Example image (f) and quantification (k) of newly formed m-OLs. Two-tailed paired t-test, n = 8 mice, P = 0.0064. g,l, Example image (g) and quantification (l) of mGFP+EdU+ OPCs. Two-tailed paired t-test, n = 5 mice, P = 0.018. m, Quantification of mGFP+EdU+PDGFRα− newly formed OLs. Two-tailed paired t-test, n = 5 mice, P = 0.1763. White arrowheads represent cell bodies, pink arrowheads MBP+CASPR+mGFP+ myelin sheath. *P < 0.05, **P < 0.01, ***P < 0.001. Scale bars, 100 µm (c), 10 µm (d–g). Additional statistical details available in Supplementary Table 1. Contra, hemisphere contralateral to the deprived eye; ipsi, hemisphere ipsilateral to the deprived eye; MD, monocular deprivation; NS, not significant; tam, tamoxifen.

