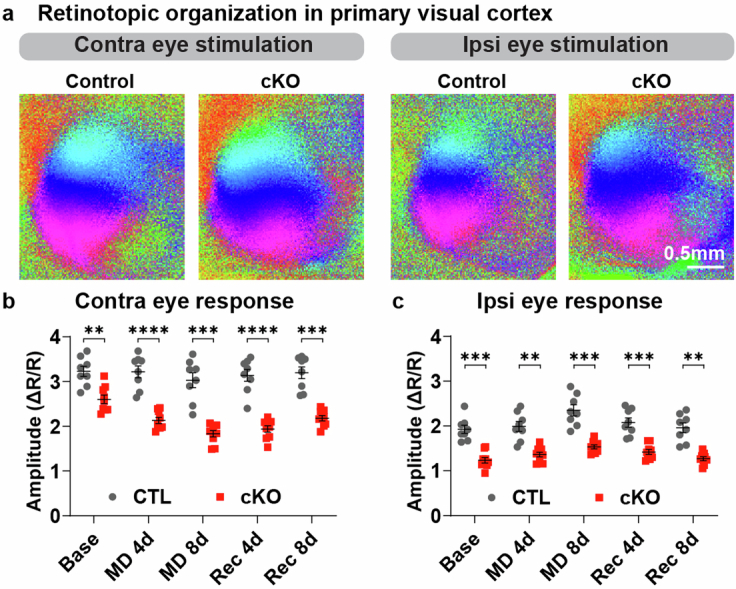
Extended Data Fig. 8. Retinotopic organization and amplitude of visual cortex responses to visual stimulation in adult control and Myrf cKO mice.

(A) Example intrinsic signal images of retinotopy in primary visual cortex. (B, C) Amplitude of intrinsic signal imaging responses to stimulation of the contralateral deprived eye (contra; p < 0.0001) or ipsilateral non-deprived eye (ipsi; p < 0.0001) in binocular visual cortex of control (CTL) and cKO mice. Panels B-C: two-way ANOVA followed by Sidak’s multiple comparisons test, n = 8 CTL mice and 9 cKO mice. Data are presented as mean +/- SEM. **p < 0.01, ***p < 0.001, ****p < 0.0001. Additional statistical details in Table S1.
