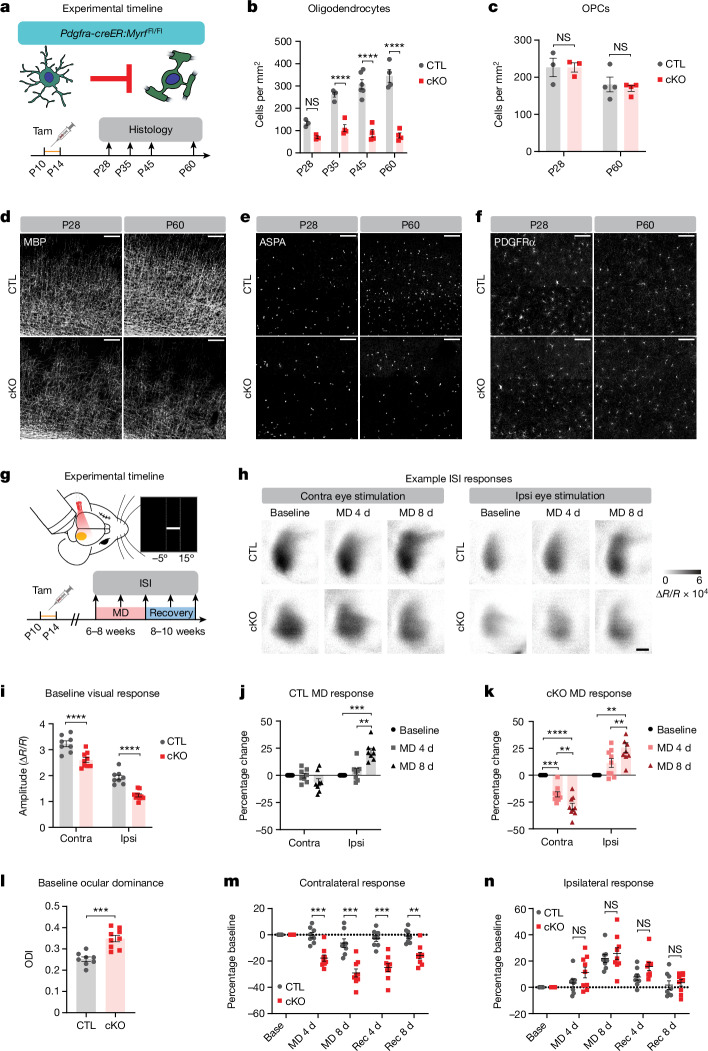
Fig. 2. Impairment of adolescent oligodendrogenesis disrupts adult visual cortex activity and enhances experience-dependent neuronal plasticity.
a, Experimental strategy and histology timeline. b,e, Quantification (b, P = 0.0002) and example images (e) of mature oligodendrocytes in the visual cortex at P28 and P60 in CreER− (CTL) and CreER+ (cKO) mice. c,f, Quantification (c, P = 0.7504) and example images (f) of OPCs in visual cortex. d, Example images of myelin in visual cortex. g, Experimental strategy and timeline for intrinsic signal imaging (ISI). h, Example images from ISI. i,l, Amplitude of ISI responses (i, P < 0.0001) and ocular dominance (l) in binocular visual cortex at baseline (P = 0.0001). j, Change in ISI responses in adult control mice following 4 or 8 days of MD (contra, P = 0.1804; ipsi, P < 0.0001). k, Change in ISI responses in adult cKO mice (contra, P < 0.0001; ipsi, P < 0.0001). m, Change in ISI responses to contralateral eye stimulation following MD and recovery (rec) (P < 0.0001). n, Change in ISI responses to ipsilateral eye stimulation (P = 0.3008). b,c, Two-way analysis of variance (ANOVA) with Sidak’s multiple-comparisons test, n = 3–6 mice per age, per genotype; i, two-way ANOVA with Sidak’s multiple-comparisons test; j,k, one-way repeated-measures ANOVA followed by Tukey’s multiple-comparisons test; l, unpaired two-tailed t-test. m,n, two-way ANOVA with Sidak’s multiple-comparisons test; i–n, n = 8 CTL mice and n = 9 cKO mice. Data presented as mean ± s.e.m. **P < 0.01, ***P < 0.001, ****P < 0.0001. Additional statistical details are provided in Supplementary Table 1. Scale bars, 100 µm (d–f), 0.5 mm (h). MD 4 d/8 d, following 4 days/8 days of MD; ODI, ocular dominance index, defined as (contra − ipsi responses)/(contra + ipsi). ∆R/R, change in relative reflectance.

