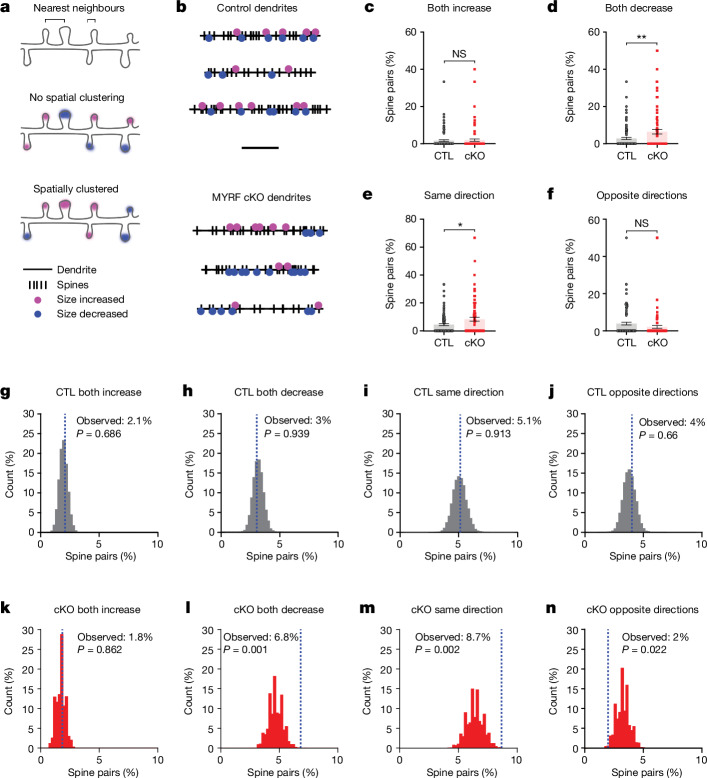
Fig. 4. Monocular deprivation induces spatially clustered spine size decreases in adult mice with impaired adolescent oligodendrogenesis.
a, Schematic of nearest-neighbour analysis. Brackets indicate two examples of pairs of nearest-neighbouring spines. b, Spinodendrograms of three example dendrites per group. Scale bar, 20 μm. c–f, Percentage of spine pairs per dendrite that either increased (c, P = 0.7427), decreased (d, P = 0.0052), changed in the same direction (e, P = 0.0112) or changed in opposite directions (f, P = 0.1052) in CTL and cKO mice. g, Distribution of percentage of spine pairs that increased together (P = 0.686) from 10,000 random spine–location pairings in control mice; blue dashed line denotes the observed percentage of spine pairs. h–j, Distribution of percentages of random spine pairs that either decreased together (h, P = 0.939), changed in the same direction (i, P = 0.913) or changed in opposite directions (j, P = 0.66) in control mice. k–n, Distribution of percentages of random spine pairs (and observed percentage, blue dashed line) that either increased (k, P = 0.862), decreased (l, P = 0.001), changed in the same direction (m, P = 0.002) or changed in opposite directions (n, P = 0.022) in cKO mice. c–f, Unpaired two-tailed t-tests, n = 110 dendrites from ten CTL mice and n = 96 dendrites from ten cKO mice; data presented as mean ± s.e.m. g–n, Monte Carlo P values, n = 996 spine pairs from ten CTL mice and n = 704 spine pairs from ten cKO mice. *P < 0.05, **P < 0.01. Additional statistical details are provided in Supplementary Table 1.

