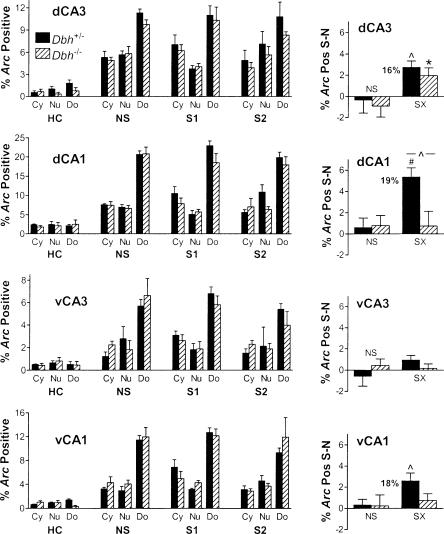
Figure 6.
Compartment analysis of Arc labeling and identification of salient context-specific labeling in the hippocampus. On the left are the percentages of cells labeled either in the cytoplasm (Cy, unique labeling for the first epoch), the nucleus (Nu, unique labeling for the second epoch), or both (Do, double, common to both epochs) for each treatment. Only the main effect of Arc labeling by compartment was significant, and this was true for groups NS, S1 and S2 (but not HC) for each region (P < 0.01). On the right are the mean residual labeling percentages after subtracting the values for context N from context S for each mouse, as a percentage of all cells analyzed, including unlabeled neurons. Significant residual (salient context-specific) labeling was observed in dCA3, dCA1, and vCA1 for the control mice and dCA3 for the Dbh-/- mice. There was a significant difference in residual labeling between genotypes for dCA1. Numbers next to Dbh+/- SX bars indicate the percent increase in Arc labeling in context S relative to context N when significant residual labeling is present.

