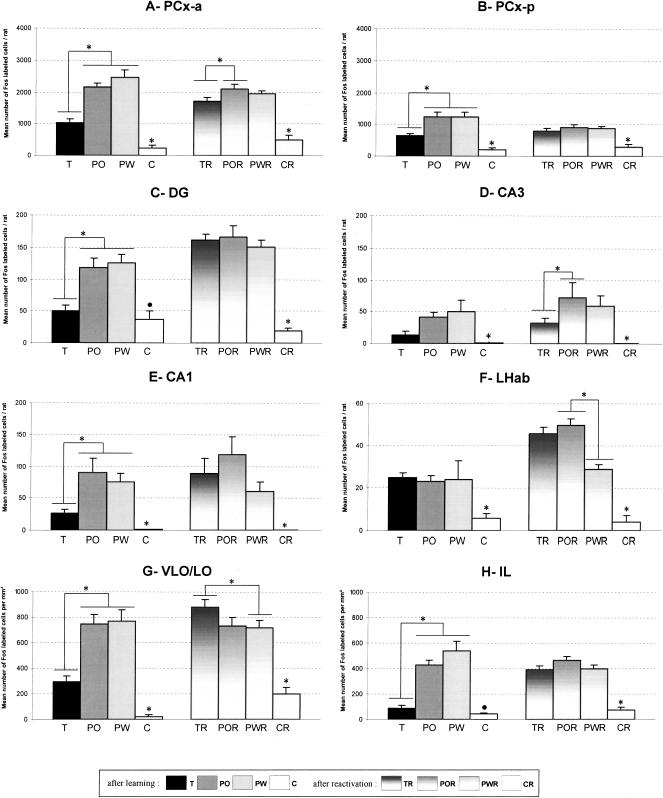
Figure 2.
The number of Fos-immunoreactive cells (mean ± SEM) in the brain areas analyzed in all the experimental groups after either initial conditioning in the maze or mnesic reactivation. Asterisks (*) indicate a significant difference (P < 0.05). Note that, except in LHab, Fos expression was higher in the PO and PW compared to the T rats. (A,B) Fos expression in the PCx-a and PCx-p. In all experimental groups except home-cage controls, the number of labeled cells in the PCx-a was significantly higher than in the PCx-p. In the PCx-a, the number of immunoreactive cells was significantly decreased in the TR rats compared to POR rats. (C-E) Fos immunoreactivity in the hippocampus subfields DG, CA3, and CA1, respectively. In the DG, as indicated by the circle (•), the C rats were significantly different from the PO and PW rats but not from the T rats. In the DG and CA1, no difference was found among the TR, POR, and PWR rats. In contrast, the number of immunoreactive cells in CA3 was significantly decreased in the TR rats compared to the POR rats. (F) Fos expression in the LHab. (G,H) Fos immunoreactivity in the frontal regions VLO/LO and IL, respectively. In the VLO/LO, Fos immunoreactivity was significantly increased in the TR rats compared to POR, PWR, and T rats. In the IL, as indicated by the circle (•), the C rats exhibited a significantly lower number of Fos-positive cells compared to the PO and PW rats but were not different from the T rats.

