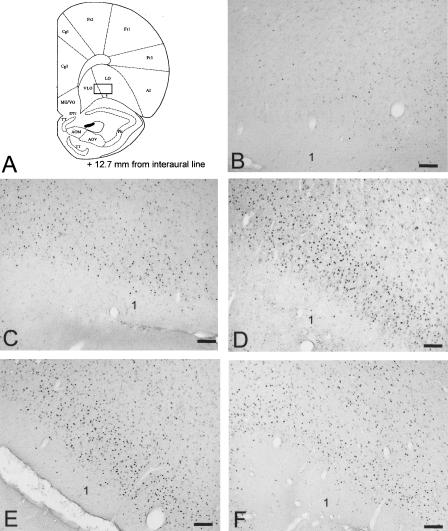
Figure 5.
(A) Schematic (Paxinos and Watson 1986) of a coronal section taken +12.7 mm from the interaural line. The rectangle illustrates the location of the sample region in which labeled cells were counted in the VLO/LO. (B-F) Photomicrographs illustrating Fos labeling in the VLO/LO in C, T, PO, TR, and PWR rats, respectively. Scale bar, 100 μm; 1, neocortical layer 1.

