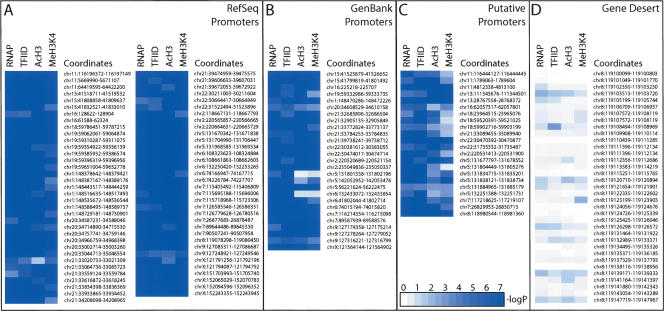
Figure 5.
Summary of histone modification status obtained for each PIC-binding site identified in IMR90 cells. White to blue gradient coloring is used to represent the negative logarithmic P values indicated in each column for RNAP ChIP, TAF250 ChIP, Acetyl Histone H3 (AcH3) ChIP, and Methyl K4 Histone H3 (MeH3K4) ChIP experiment data. (A) RefSeq supported promoters are listed. (B) GenBank supported promoters; (C) putative promoters; (D) transcriptionally inactive, heterochromatic region within ENr321 (gene desert). Actual confidence values for all the promoters are provided in Supplemental Tables S1 and S2. The coloring scale is noted in the bottom inset in C.

