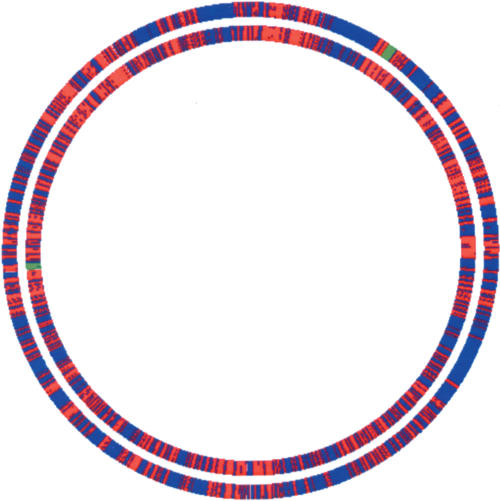
Figure 2.
Map of the E. coli chromosome where genes colored red are those genes of E. coli that belong to a team also found in S. typhi and Y. pestis. Genes colored blue do not belong to a microsyntenic region shared by the three species. The inner circle shows the results of DomainTeam (δ = 3). The outer circle shows those of GeneTeam (δ = 3), based on the set of 2106 triplets of orthologous proteins obtained by the bidirectional best hit method. Syntenic regions reported by DomainTeam and GeneTeam coincide, but DomainTeam finds larger syntenic regions and identifies 2207 syntenic genes (52% of the E. coli genes) versus 1662 (40%) for GeneTeam. Green regions indicate the largest teams (31 and 26 genes) for DomainTeam and GeneTeam respectively. Figure 2 was drawn using GenomeViz (Ghai et al. 2004).

