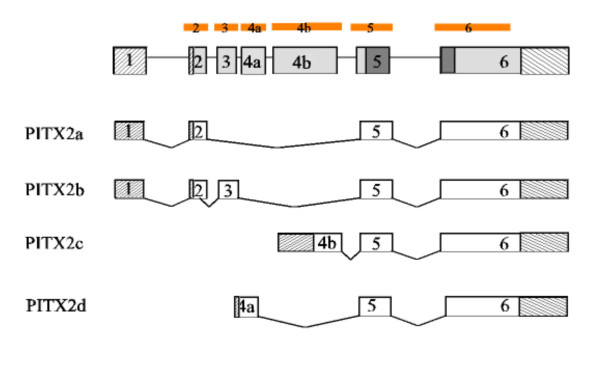
Figure 1.

Schematic diagram of PITX2 isoforms a, b, c and d. The genomic organization of the PITX2 gene is given on top, exons are numbered, 5' and 3' UTRs of the different possible transcripts are indicated by striped boxes and the homeodomain is shaded in dark grey. Modified from Cox et al, 2002 [24]. The regions of the PITX2 gene included in the mutational screening are indicated as orange bars at the very top of the scheme.
