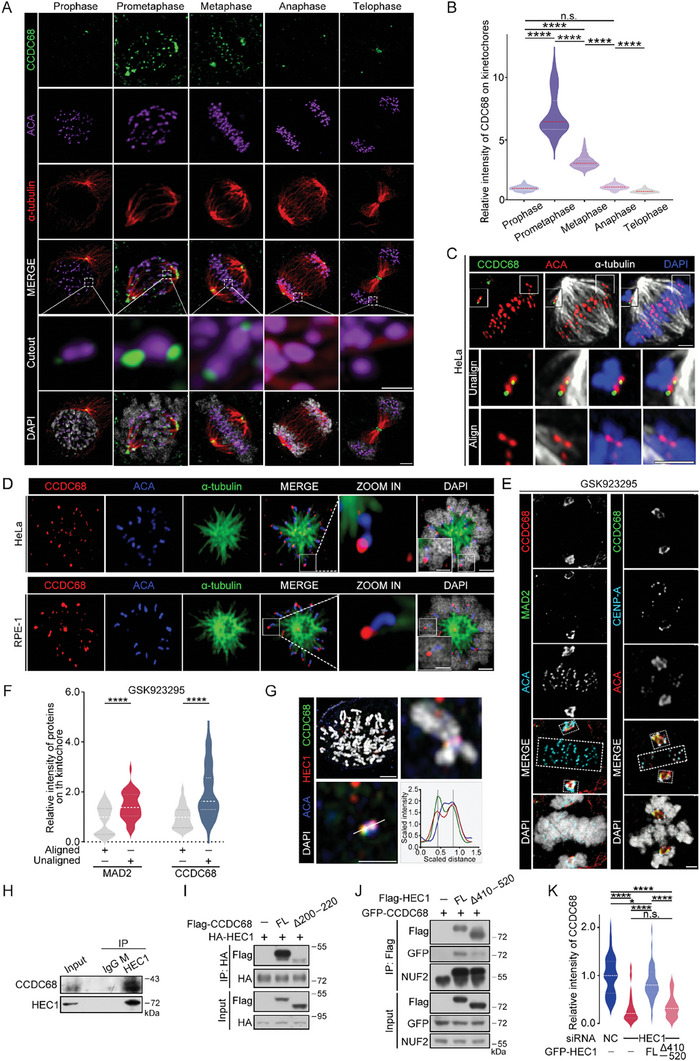
Figure 1.

CCDC68 localizes to the outer plate of unaligned kinetochores by interacting with HEC1. A) Immunofluorescence staining for CCDC68 (green), ACA (purple), and α‐tubulin (red) in wild‐type (WT) HeLa cells at different stages of mitosis. DNA was stained with DAPI (white). Scale bars, 2 µm, scale bars in the cut‐out, 0.5 µm. B) Quantification of the fluorescence intensity of CCDC68 staining on kinetochores shown in (A). More than 100 kinetochores from 10 cells were analyzed. C) Immunofluorescence staining for CCDC68 (green), ACA (red), and α‐tubulin (white) in WT HeLa cells. DNA was stained with DAPI (blue). Scale bars in the full images, 2 µm; scale bars in the cut‐out, 0.5 µm. D) Immunofluorescence staining for CCDC68 (red), α‐tubulin (green), and ACA (blue) in monastrol‐treated HeLa or RPE‐1 cells. DNA was stained with DAPI (white). Scale bar in the full image, 2 µm; Scale bar in the cut‐out, 0.5 µm. E) Immunofluorescence staining for CCDC68 (green), CENP‐A (cyan), and ACA (red) in HeLa cells treated with GSK923295 for 3 h (right panel); immunofluorescence staining for CCDC68 (red), MAD2 (green), and ACA (cyan) in HeLa cells treated with GSK923295 for 3 h (left panel). DNA was stained with DAPI (white). The aligned kinetochore is included in dotted boxes at the equator plate. Unaligned kinetochore is included in dotted boxes at the spindle poles. Scale bars, 2 µm. F) Quantification of the relative fluorescence intensity of CCDC68 and MAD2 staining on the kinetochores shown in (E). More than 100 kinetochores from 10 cells were analyzed. G) Immunofluorescence staining for CCDC68 (green), HEC1 (red), and ACA (blue) in HeLa cells after the chromosome spread assay. DNA was stained with DAPI (white). The quantitative plot shows the fluorescence intensity along the white line of the image. Scale bar in the full image, 2 µm; Scale bar in the cut‐out, 0.5 µm. H) Lysates from HeLa cells were subjected to immunoprecipitation (IP) with an anti‐IgG (mouse) or anti‐HEC1 antibody, and the resulting samples were analyzed by immunoblotting with the indicated antibodies. I) Lysates from HEK293T cells cotransfected with Flag‐vector, Flag‐CCDC68‐Full length (FL), or Flag‐CCDC68‐Δ200–220 and HA‐HEC1 were subjected to coimmunoprecipitation, and the resulting samples were analyzed by immunoblotting with the indicated antibodies. J) Lysates from HEK293T cells cotransfected with Flag‐vector, Flag‐HEC1‐Full length (FL), or Flag‐ HEC1‐Δ410–520 and GFP‐CCDC68 were subjected to coimmunoprecipitation, and the resulting samples were analyzed by immunoblotting with the indicated antibodies. K) Quantification of the fluorescence intensity of CCDC68 staining on kinetochores in (Figure S2L, Supporting Information). More than 100 kinetochores from ten cells were analyzed. All the data are presented as the means of the indicated biological replicates; error bars represent the means ± SEMs. Statistical analyses were performed using Student's t‐test for (F) and using one‐way ANOVA for (B) and (K). n.s., not significant. *p < 0.05, **p < 0.01, ***p < 0.001, ****p < 0.0001.
