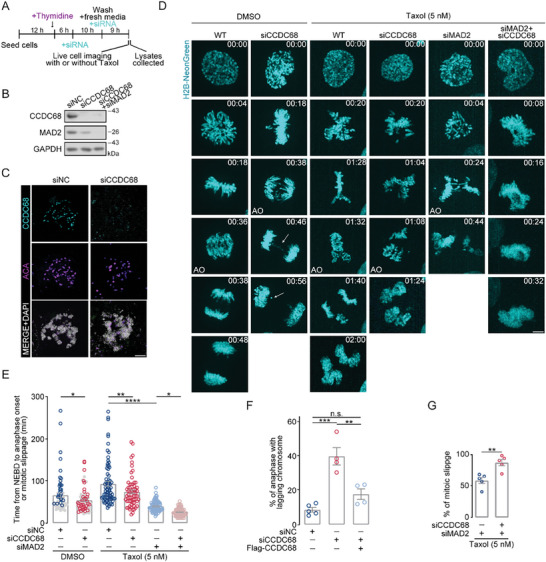
Figure 2.

CCDC68 depletion accelerates anaphase onset and leads to chromosome lagging. A) Schematic diagram of the compound and siRNA treatment process in (B) and (D). B) Immunoblots showing the depletion of CCDC68 (siCCDC68) alone or CCDC68 and MAD2 (siCCDC68+siMAD2) in HeLa cells. GAPDH served as the loading control. NC, negative control. C) Immunofluorescence staining for CCDC68 (cyan) and ACA (purple) in HeLa cells transfected with siNC or siCCDC68. Scale bars, 2 µm. D) Live‐cell imaging of wild‐type (WT) HeLa cells or HeLa cells transfected with siNC, siCCDC68, siMAD2, or both siCCDC68 and siMAD2 and then subjected to drug treatment. Cells also stably expressed H2B‐NeonGreen. The time of nuclear envelope breakdown was set to zero; the time is presented in minutes on each channel image. The white arrow indicates mitotic defects. AO: anaphase onset. Scale bars, 5 µm. E) The time from NEBD to anaphase onset or mitotic slippage was quantitated from the time‐lapse analysis in (D). The gray circles represent the normal mitotic cells, and the blue circles and red circles represent the cells with mitotic defects in DMSO treatment groups. F) Quantification of the percentage of mitotic slippage from the dataset as in (D) and (Figure S3D, Supporting Information). G) Quantification of the percentage of anaphase with lagging chromosomes from the dataset as in (D). All the data are presented as the means of the indicated biological replicates; error bars represent the means ± SEMs. Statistical analyses were performed using Student's t‐test for (G) and using one‐way ANOVA for (E) and (F). n.s., not significant (p > 0.05), *p < 0.05, **p < 0.01, ***p < 0.001, ****p < 0.0001.
