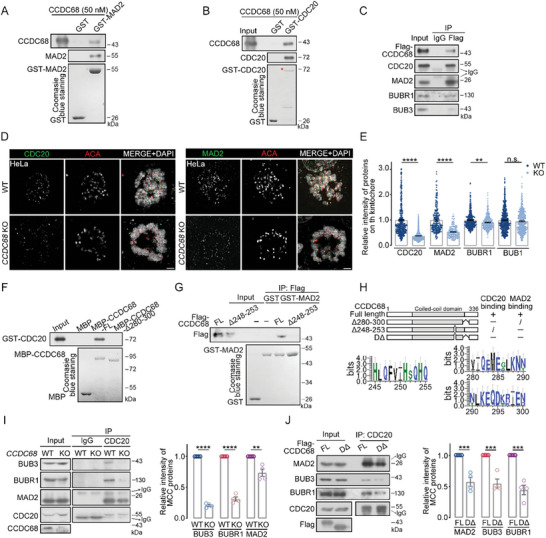
Figure 3.

CCDC68 stabilizes MCC by interacting with CDC20 and MAD2. A) Purified CCDC68 (50 nM) was incubated with either GST or GST‐MAD2. The samples were analyzed by Coomassie blue staining and immunoblotting with the indicated antibodies. B) Purified CCDC68 (50 nm) was incubated with either GST or GST‐CDC20. The samples were analyzed by Coomassie blue staining and immunoblotting with the indicated antibodies. The red asterisk indicates GST‐CDC20. C) Lysates from CCDC68‐knockout (KO) cells stably expressing Flag‐CCDC68 were synchronized to prometaphase and subjected to immunoprecipitation (IP) with an anti‐Flag antibody, and samples were analyzed by immunoblotting with the indicated antibodies. D) Immunofluorescence images of wild‐type (WT) and CCDC68‐KO HeLa cells stained for CDC20 (green, left panel) or MAD2 (green, right panel) and ACA (red). DNA was stained with DAPI (blue). Scale bars: 2 µm. E) Quantification of the relative fluorescence intensity of proteins on kinetochores shown in (D), (Figure S4F, Supporting Information), and (Figure S4G, Supporting Information). More than 100 kinetochores from ten cells were analyzed. F) Purified MBP, MBP‐CCDC68‐Full length (FL) or MBP‐CCDC68‐Δ280–300 was incubated with GST‐CDC20. The samples were analyzed by Coomassie blue staining and immunoblotting with the indicated antibodies. G) Lysates of HEK293T cells expressing Flag‐CCDC68‐Full length (FL) or Flag‐CCDC68‐Δ248–253 were incubated with purified GST or GST‐MAD2. The samples were analyzed using immunoblotting with the indicated antibodies and Coomassie blue staining. H) Alignment of residues 245–255 and 280–300 from model organisms. The size of the amino acid letters represents the level of conservation. I) Lysates from WT and CCDC68‐KO HeLa cells were synchronized to prometaphase and subjected to IP with an anti‐CDC20 antibody, and the resulting samples were analyzed by immunoblotting with the indicated antibodies. Quantification of the relative intensity of MCC proteins is shown. J) Lysates from CCDC68‐KO cells stably expressing Flag‐CCDC68‐Full length (FL) or Flag‐CCDC68‐DΔ (Δ248–253 and Δ280–300) were synchronized to prometaphase and subjected to IP with an anti‐CDC20 antibody, and the protein levels in the resulting samples were measured by immunoblotting. Quantification of the relative intensity of MCC proteins is shown. All the data are presented as the means of the indicated biological replicates; error bars represent the means ± SEMs. Statistical analyses were performed using Student's t‐test for (E), (I), and (J). n.s., not significant. *p < 0.05, **p < 0.01, ***p < 0.001, ****p < 0.0001.
