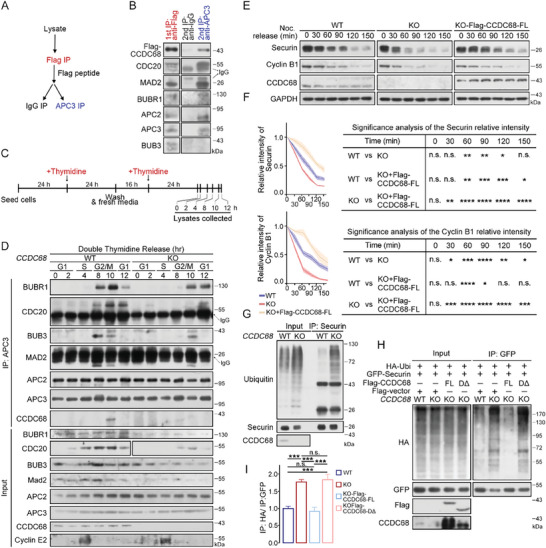
Figure 4.

CCDC68 limits APC/C‐dependent ubiquitinated degradation by inhibiting MCC disassembly. A) Schematic diagram of the sequential immunoprecipitation (IP) process. B) Lysates from HeLa cells were subjected to IP with an anti‐Flag antibody and eluted with 50 µm Flag‐peptide. The eluent was incubated with Protein G beads coated with an IgG or APC3 antibody. The samples were analyzed by immunoblotting with the indicated antibodies. C) Schematic diagram of the compound treatment process in (D). D) Wild‐type (WT) and CCDC68‐knockout (KO) HeLa cells were synchronized by double‐thymidine treatment. The cells were then harvested, lysates were subjected to IP with an anti‐APC3 antibody, and the protein levels in the resulting samples were measured by immunoblotting. E) WT, CCDC68‐KO, and CCDC68‐KO HeLa cells stably expressing Flag‐CCDC68‐Full Length (FL) were synchronized by thymidine‐nocodazole treatment. Mitotic shake‐off cells were collected, washed twice with PBS, and released in fresh medium. The cells were then harvested at various time points as indicated. The cells were then processed, and the protein levels in the resulting samples were measured by immunoblotting. GAPDH served as the loading control. F) Quantification of the relative intensity of securin and cyclin B1 shown in (E). G) Lysates from WT and CCDC68‐KO HeLa cells were subjected to IP with an anti‐securin antibody, and the samples were analyzed using immunoblotting with the indicated antibodies. H) WT, CCDC68‐KO, and CCDC68‐KO cells stably expressing Flag‐CCDC68‐Full length (FL) or Flag‐CCDC68‐DΔ were transfected with HA‐ubiquitin (HA‐Ubi) and GFP‐securin. The cells were subjected to IP with an anti‐GFP antibody. The level of exogenous GFP‐securin ubiquitin was detected with an anti‐HA antibody. I) Quantification of the relative intensity shown in (H). All the data are presented as the means of the indicated biological replicates; error bars represent the means ± SEMs. Statistical analyses were performed using one‐way ANOVA for (F) and (I). n.s., not significant, *p < 0.05, **p < 0.01, ***p < 0.001, ****p < 0.0001.
