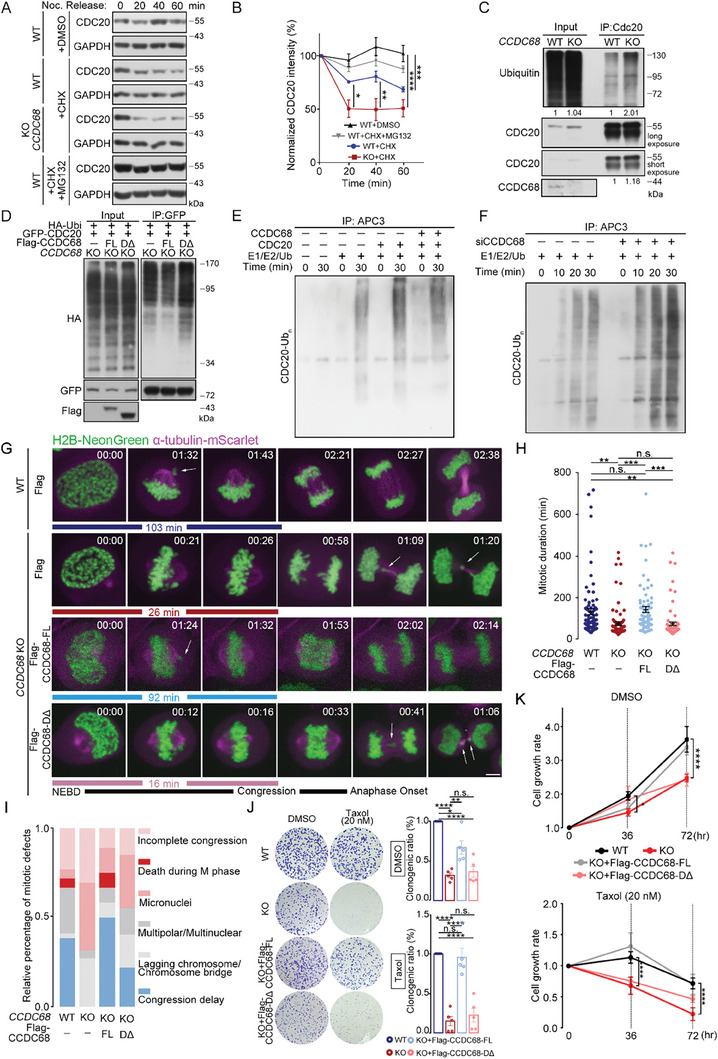
Figure 5.

CCDC68 stabilizes the MCC by inhibiting the ubiquitination‐dependent turnover of CDC20. A) Cells were treated with cycloheximide (CHX), as indicated, to block protein synthesis. The proteasome inhibitor MG132 was added as indicated. The immunoblot shows CDC20 degradation in wild‐type (WT) and CCDC68‐KO cells that were arrested in prometaphase. B) Quantification of the relative intensity is shown in (A). C) Lysates from WT and CCDC68‐KO HeLa cells were subjected to IP with an anti‐CDC20 antibody, and the samples were analyzed by immunoblotting with the indicated antibodies. D) CCDC68‐KO cells stably expressing Flag‐vector, Flag‐CCDC68‐Full length (FL) or Flag‐CCDC68‐DΔ (Δ248–253 and Δ280–300) were cotransfected with HA‐ubiquitin (HA‐Ubi) and GFP‐CDC20. Lysates were subjected to IP with an anti‐GFP antibody, and samples were analyzed by immunoblotting with the indicated antibodies. E) The APC/C was immunoprecipitated by anti‐APC3 antibody‐incubated beads from the extracts of cells that were synchronized by double‐thymidine treatment. The APC/C was supplemented with purified CCDC68, CDC20, or E1/E2/Ub and incubated for 0 or 30 min. After incubation, the samples were analyzed by immunoblotting with the indicated antibodies. CDC20‐Ubn, ubiquitinated CDC20. F) WT or CCDC68‐depleted HeLa cells were synchronized by double‐thymidine treatment to collect mitotic cells. The APC/C was immunoprecipitated with anti‐APC3 antibody‐incubated beads and supplemented with E1/E2/Ub, and then incubated for the indicated time points. After incubation, the samples were analyzed by immunoblotting with the indicated antibodies. CDC20‐Ubn, ubiquitinated CDC20. G) Live‐cell imaging of wild‐type (WT), CCDC68‐knockout (KO), and CCDC68‐KO HeLa cells stably expressing Flag‐CCDC68‐Full length (FL) or Flag‐CCDC68‐DΔ. The cells also stably expressed H2B‐NeonGreen and α‐tubulin‐mScarlet. The time of nuclear envelope breakdown (NEBD) was set to zero; time is presented in minutes on each channel image. The white arrow indicates mitotic defects. Scale bars, 5 µm. DΔ: Δ248–253 and Δ280–300. H) Time from NEBD to anaphase onset was quantitated from the time‐lapse analysis shown in (G). I) Quantification of different types of mitotic defects from the same dataset as in (G). J) Colony formation of WT, CCDC68‐KO, and CCDC68‐KO HeLa cells stably expressing Flag‐CCDC68‐Full length (FL) or Flag‐CCDC68‐DΔ in the presence of DMSO or taxol (20 nm). Quantification of the clonogenic ratio. K) The cell growth rate was evaluated using the CCK‐8 assay. WT, CCDC68‐KO, and CCDC68‐KO HeLa cells stably expressing Flag‐CCDC68‐Full length (FL) or Flag‐CCDC68‐DΔ were treated with DMSO or taxol for the indicated times. All the data are presented as the means of the indicated biological replicates; error bars represent the means ± SEMs. Statistical analyses were performed using one‐way ANOVA for (B), (H), (J), and (K). n.s., not significant, *p < 0.05, **p < 0.01, ***p < 0.001, ****p < 0.0001.
