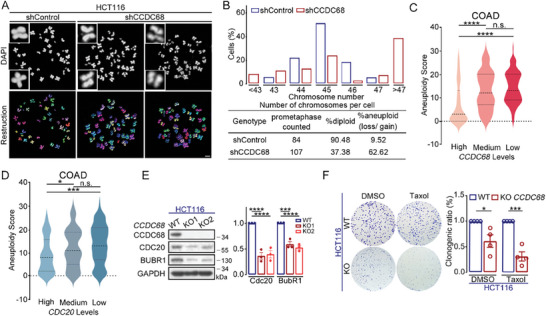
Figure 6.

Downregulation of CCDC68 induces aneuploidy. A) Images of DAPI‐stained mitotic spread in shControl or shCCDC68 HCT116 cells (upper panel). Schematic representation of the 3D reconstruction of chromosome spread (lower panel). Scale bar: 5 µm. B) Quantification of the distribution of the total chromosome number and the percentage of diploid and aneuploid cells shown in (A). C,D) Bioinformatics analysis of aneuploidy scores in association with CCDC68 mRNA expression (C) and CDC20 mRNA expression (D) in colon cancer patients. The mRNA expression data were downloaded from the TCGA database (https://www.cbioportal.org/). COAD: colon adenocarcinoma. E) Immunoblotting of lysates from wild‐type (WT) and CCDC68‐knockout (KO) HCT116 cells. The cells were treated with nocodazole for 16 h then released to fresh media for 30 min. GAPDH served as the loading control. Quantification of the relative intensity. F) Colony formation of WT and CCDC68‐KO HCT116 cells in the presence of DMSO or Taxol (20 nm). Quantification of the clonogenic ratio. All the data are presented as the means of the indicated biological replicates; error bars represent the means ± SEMs. Statistical analyses were performed using Student's t‐test for (F) and using one‐way ANOVA for (C–E). n.s., not significant. *p < 0.05, **p < 0.01, ***p < 0.001, ****p < 0.0001.
